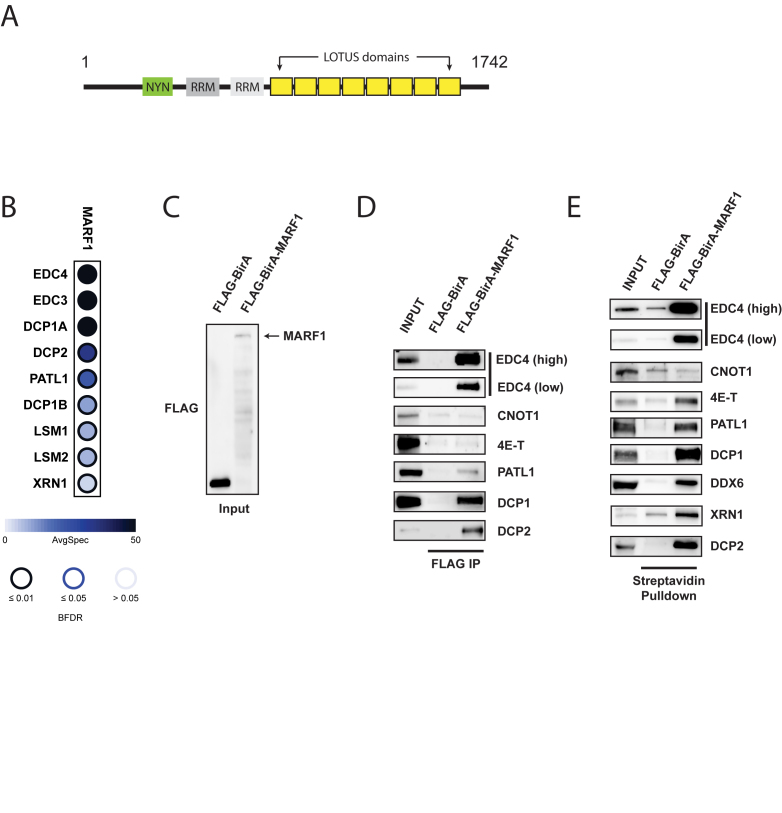
Figure 1.
MARF1 interacts with the DCP1:DCP2 mRNA decapping complex. (A) Schematic diagram of full-length MARF1. (B) Dot plot depicting high-confidence protein interactions identified by affinity purification of FLAG-MARF1 in HEK293 cells. SAINT analysis of two independent experiments was performed and a subset of high-confident preys is presented in this dot plot. Node color represents the average spectral counts, and the node edge color corresponds to the SAINTexpress Bayesian FDR value (BFDR). (C) Western blot analysis of lysates derived from HEK293 cells expressing either FLAG-BirA* or FLAG-BirA*-MARF1 and probed with anti-FLAG antibody. (D) Immunoprecipitation (IP) of FLAG-BirA* and FLAG-BirA*-MARF1 from benzonase–treated HEK293 cell extracts using anti-FLAG antibody. Immunoprecipitated complexes were separated by SDS-PAGE and probed with antibodies against the indicated proteins. (E) Streptavidin pulldowns of biotinylated proteins from benzonase-treated lysates outlined in (C). Precipitated proteins were subjected to SDS-PAGE and probed with antibodies against the indicated endogenous proteins. Inputs represent 2% of total lysates.

