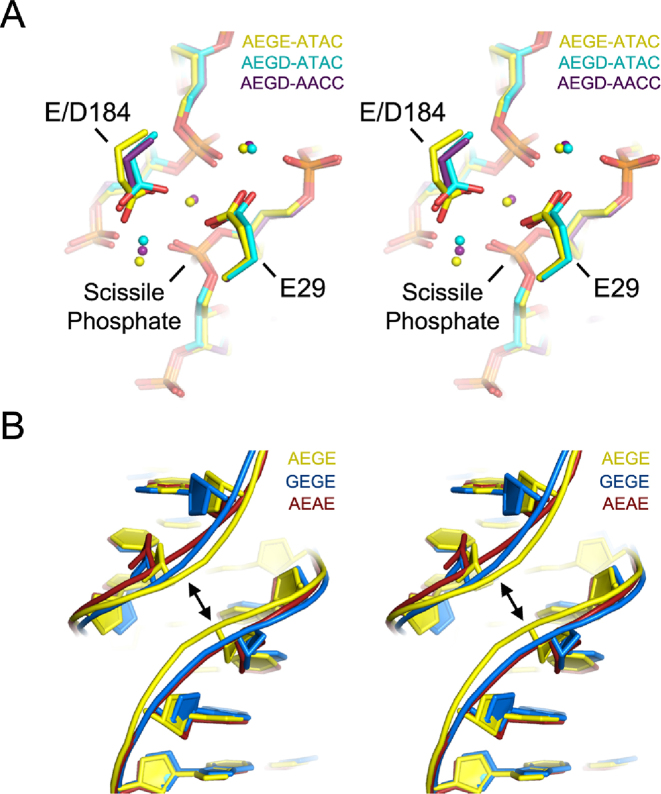
Figure 8.
Structural analyses of I-LtrI variants on the cognate ATAC and AACC substrates. (A). Stereo representation of positions 29 and 184 and DNA substrate of the AEGE-ATAC (yellow), AEGD-ATAC (cyan) and AEGD-AEGD protein–DNA complexes. Variants crystallized with the ATAC and AACC substrates. Dots represent metal ions and are color-coded according to the protein–DNA complex. (B). Stereo representation of showing changes in minor groove width in protein–DNA complexes with I-LtrI variants with substitutions in the non-metal binding residues positions (28 and 183).

