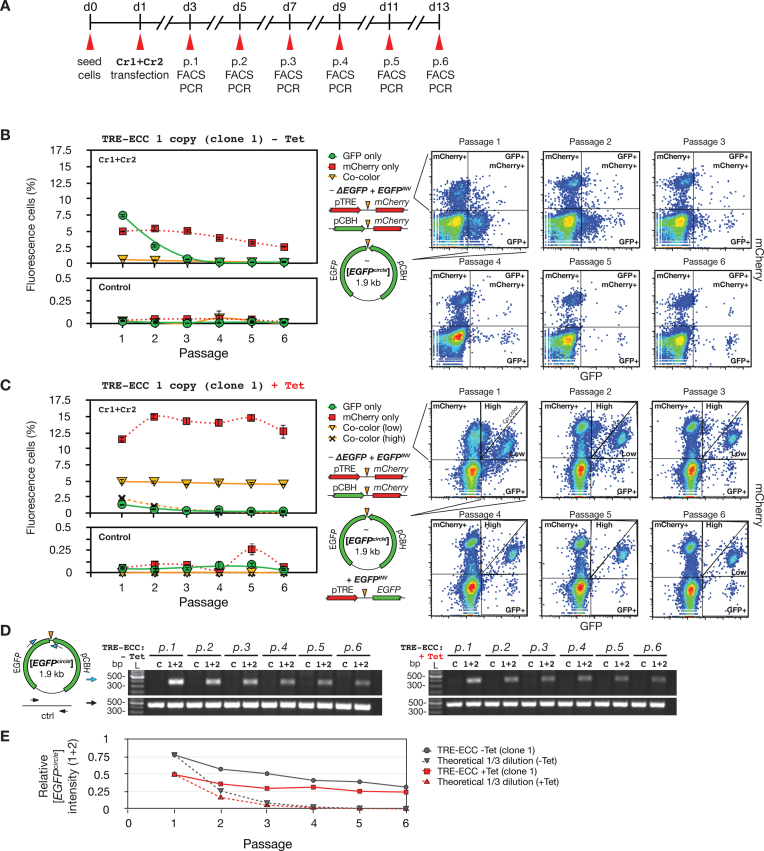
Figure 3.
Stability of eccDNAs generated by CRISPR-C. (A) Outline of time-course experiment. (B) Left, percent fluorescence cells from 1 to 6 cell passages (1:3 split-ratio) in absence of tetracycline (-Tet); right, corresponding FACS gating images. (C) As B description, cells propagated in +Tet conditions. (D) Outward PCR analysis of [EGFPcircles] at passage 1 to 6; left, -Tet; right, +Tet. Cr1+Cr2 (1+2), CRISPR gRNAs; C, control – gRNA; ctrl, DNA template control. (E) Quantification of PCR analysis by Image J, solid lines; theoretical 1/3 dilution rate, dash lines.

