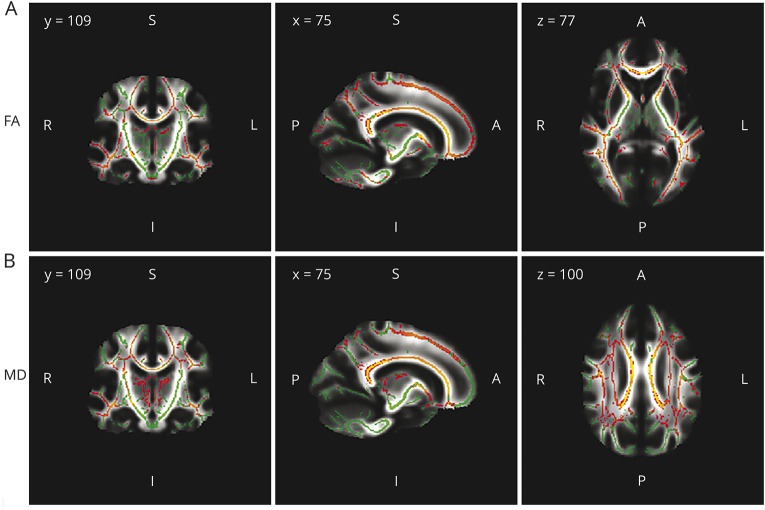
Figure 1. White matter tracts.
White matter tracts with significant fractional anisotropy (FA) reduction (A) and mean diffusivity (MD) increase (B) in patients with multiple sclerosis relative to healthy controls. Significant regions are displayed in red/yellow (gradient of significance level red < yellow). Results are shown overlaid on the mean FA skeleton (A) or on the mean MD skeleton (B), both displayed in green (nonsignificant regions). White matter voxels with lesions were excluded and therefore only the normal-appearing white matter was considered for the analysis. p Values < 0.05 were considered statistically significant, corrected for multiple comparisons controlling for family-wise error rates.

