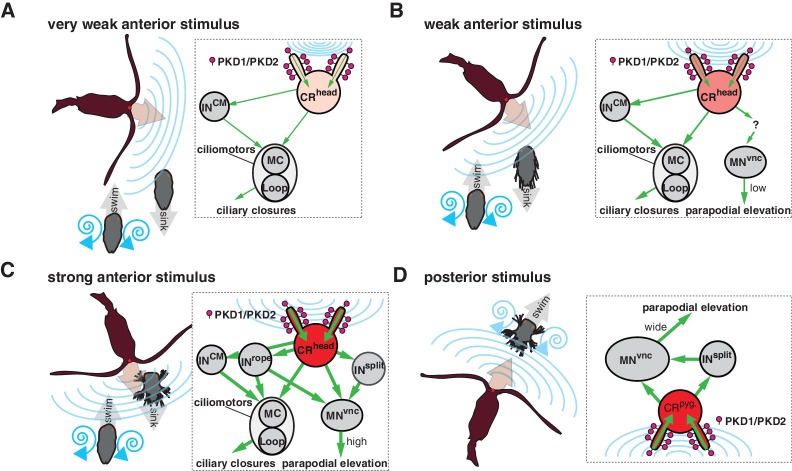
Figure 9. Summary schematics of the proposed neural implementations behind the startle response in different predator-prey scenarios.
(A–D) Different interaction scenarios between a predatory copepod (brown) and a nectochaete Platynereis larva (grey) are schematized on the left side of each panel. Blue lines schematize hydrodynamic signals produced by the copepod or the larva. Arrows indicate the direction of movement. Inset on the right of each panel shows the proposed cellular/circuit implementation behind the corresponding larval response shown to the left. Green arrows indicate the direction of propagation of the signal. PKD1-1 and PKD2-1 (symbolized as lollipops) localize to CRs, which transduce a signal of different intensity (shown with different tones of red) depending on the strength of the hydrodynamic signal (blue lines).

