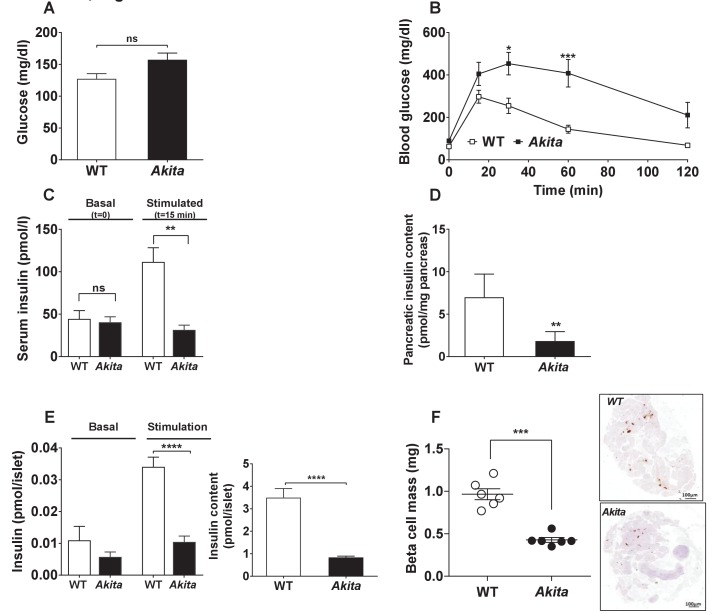
Figure 3. Metabolic state, β-cell function and mass in pre-weaning (P19-21) Akita mice and age-matched controls.
(a) fed blood glucose (n = 7 in each group); (b) IPGTT- glucose (1.5 g/kg) was injected intraperitoneally after an overnight fast (n = 5 in each group); (c) glucose-stimulated insulin secretion in vivo. Insulin was measured before and 15 min following IP glucose injection (1.5 g/kg); (d) pancreatic insulin content (n = 4–5 in each group); (e) basal (3.3 mmol/l glucose) and stimulated (16.7 mmol/l glucose) insulin secretion and insulin content of Akita and control islets analyzed by static incubations. Islets were divided into 4 batches of 25 islets per group (n = 3); (f) β-cell mass (n = 6 mice in each group). *p<0.05, **p<0.01, ***p<0.001, ****p<0.0001.

