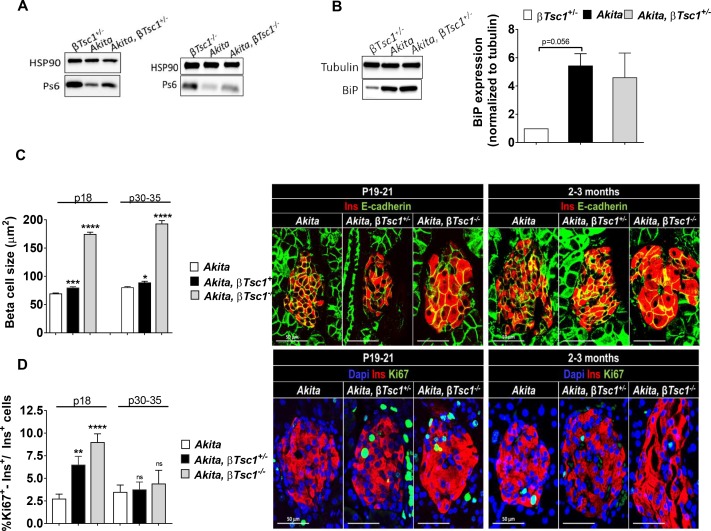
Figure 9. Effects of mTORC1 activation in neonate Akita β-cells on β-cell size and proliferation.
Studies were performed on heterozygous and homozygous βTsc1 knockout Akita mice (RIP-Cre:Tsc1flox/+:Akita (Akita, βTsc1+/-) and RIP-Cre:Tsc1flox/flox:Akita (Akita, βTsc1-/-). Tsc1flox/+:Akita and Tsc1flox/flox:Akita were used as Akita controls. RIP-Cre:Tsc1flox/+ mice (βTsc1+/-) and RIP-Cre:Tsc1flox/flox mice (βTsc1-/-) were used as WT controls (a, b). (a) Western blotting for phospho-S6 on islets from homozygous and heterozygous knockout mice and matched controls (n = 4, each sample is a pool of islets from two to four mice); (b) Western blotting and quantification of BiP expression in wild-type, Akita and Akita, βTsc1 +/- mice (n = 4, each sample is a pool of islets from two to four mice); (c) β-cell size was assessed by immunostaining for insulin and E-cadherin (n = 400–500 β-cells per group), (d) β-cell proliferation was assessed by immunostaining for insulin and Ki67 (n = 1200–1400 β−cells per group). Quantifications and representative images are shown. *p<0.05, **p<0.01, ***p<0.001, ****p<0.0001.


