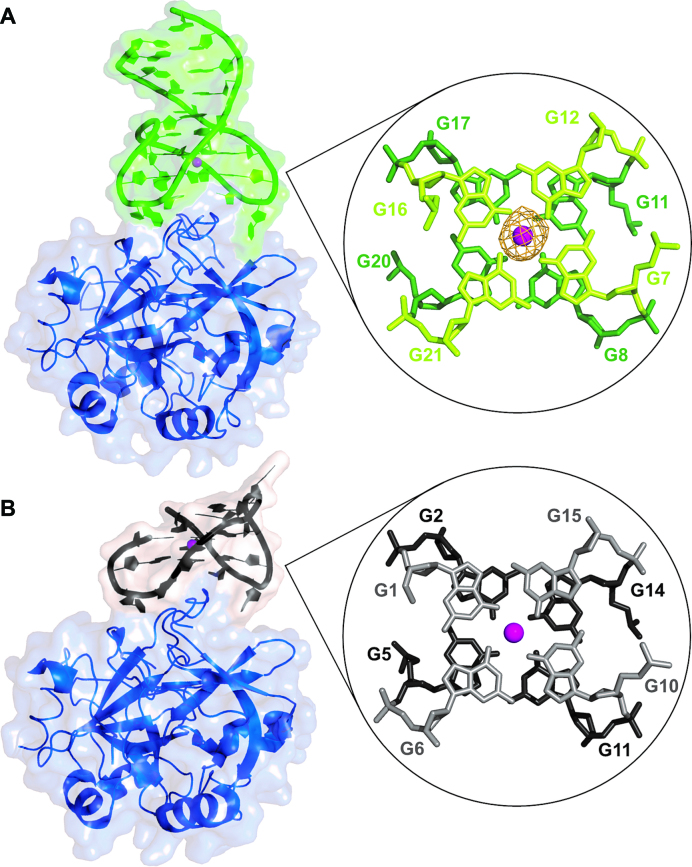
Figure 1.
On the left, surface/cartoon representations of thrombin-NU172-K (A) and thrombin-TBA-K (PDB code: 4DII) (B) complexes. Thrombin is coloured in blue, NU172 is coloured in green and TBA is coloured in black. On the right, view of the two tetrads along the G-quadruplex axis of the two aptamers. The omit Fo – Fc electron density map (orange) of the potassium ion (magenta) in NU172 is contoured at 3.0 σ level.

