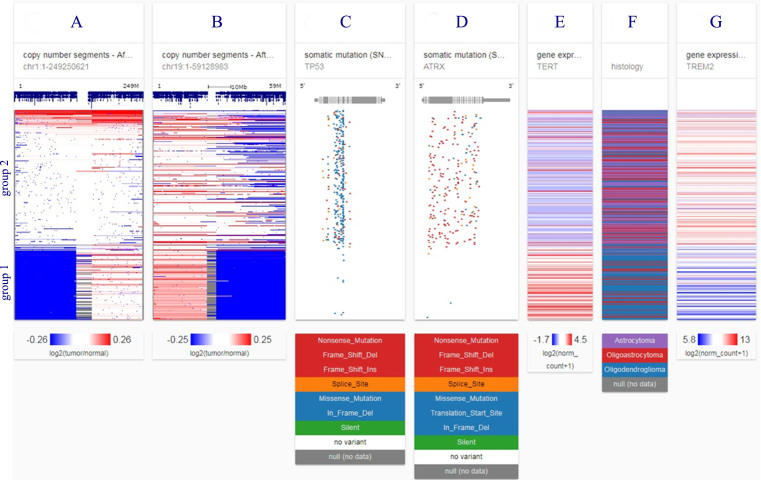
Fig.5.
Genetic separation of lower grade gliomas into two disease groups in 526 TCGA patients studied. Group 1 is characterized by loss of chromosome arms 1p and 19q (blue blocks, columns A and B) and TERT over-expression (column E); group 2 by TP53 and ATRX mutations (columns C and D). TREM2 gene expression is in column G. Astrocytoma histology (column F) and TREM2 high expression (column G) fall into group 2, the poorer prognosis group. Each row contains data from a single sample. Row order is determined by sorting the rows by their column values (UCSC Xena, http://xena.ucsc.edu). Mutation abbreviations: Frame shift del, frame shift deletion; Frame shift ins, frame shift insertion; in frame del, in frame deletion. Color codes: red, high expression, blue, low or no expression.

