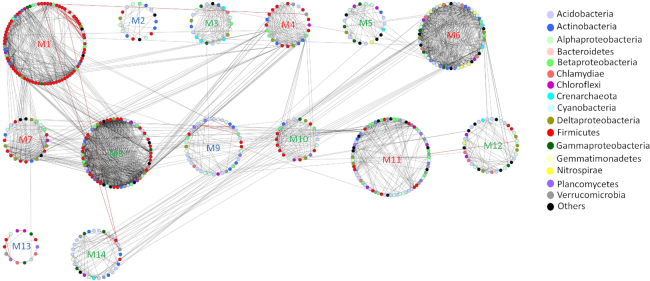
Figure 1.
Network of co-occurring OTUs pairs based on a Spearman correlation (−0.80 ≥ Ρ ≥ 0.80) with significance of adjusted P ≤ 0.01. An interaction (edge) between nodes (OTUs) implies a significant correlation. Red edges represent negative correlations, while the grey edges represent positive correlations. The network is visualized using group attributes layout in Cytoscape 3.2.1, where every module is given an arbitrary number. Among 14 modules, 6 modules are forest associated (M3, M5, M8, M10, M12 and M14; green labeling), 5 modules are pasture associated (M1, M4, M6, M7 and M11; red labeling), and 3 modules comprise both types of nodes (M2, M9 and M13; blue labeling).

