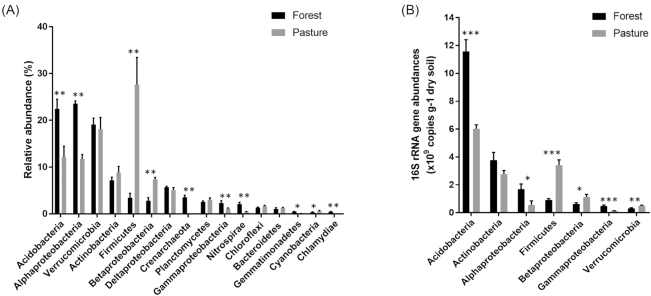
Figure 3.
Abundances of major microbial taxa in forest and pasture soils. (A)Relative abundance of major microbial phyla and classes in forest (black) and pasture (grey) networks. These microbial taxa comprise more than 98% of 16S rRNA gene reads, (B) Copy numbers of seven major bacterial phyla and classes per gram of dry soil determined by quantitative PCR in two different land uses in the Amazon. Forest, black; pasture, grey. Error bars represent the standard error. Statistical significance was calculated using Mann–Whitney test. Symbols (*), (**) and (***) indicate significance values of P < 0.05, P < 0.01 and P < 0.001, respectively.

