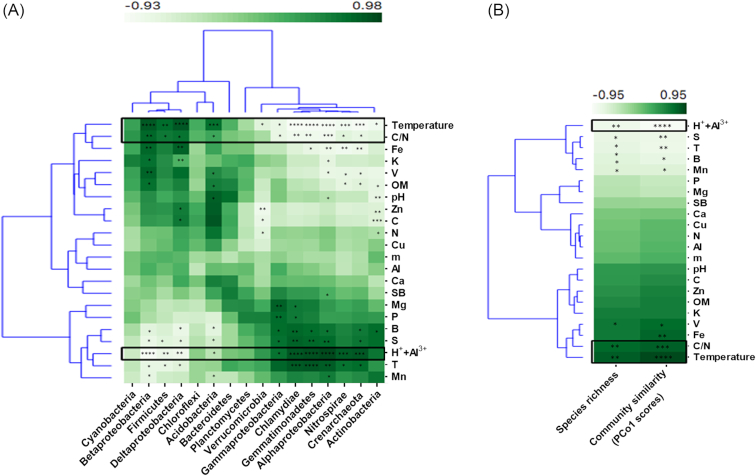
Figure 5.
Relationship between the microbial community structures and soil physicochemical parameters. (A), Pearson correlations between the relative abundances of major microbial taxa and soil variables. (B), Pearson correlations of the species richness (alpha diversity) and community similarity, the ordination score of the first axis of principal coordinate analysis (PCoA) (which explains 55.78% of the variance in the original data), with the soil variables. C, carbon; N, nitrogen; Fe, iron; V, base saturation; m, aluminum saturation; Ca, calcium; Mg, magnesium; Mn, manganese; B, boron; Cu, copper; T, cation exchange capacity; SB, sum of bases; H++Al3+, exchangeable acidity; OM, organic matter; P, phosphorus; S, sulfur. The color gradient represents the correlation strength of the relationships. Symbols (*), (**) and (***) indicate significance values of P < 0.05, P < 0.01 and P < 0.001, respectively.

