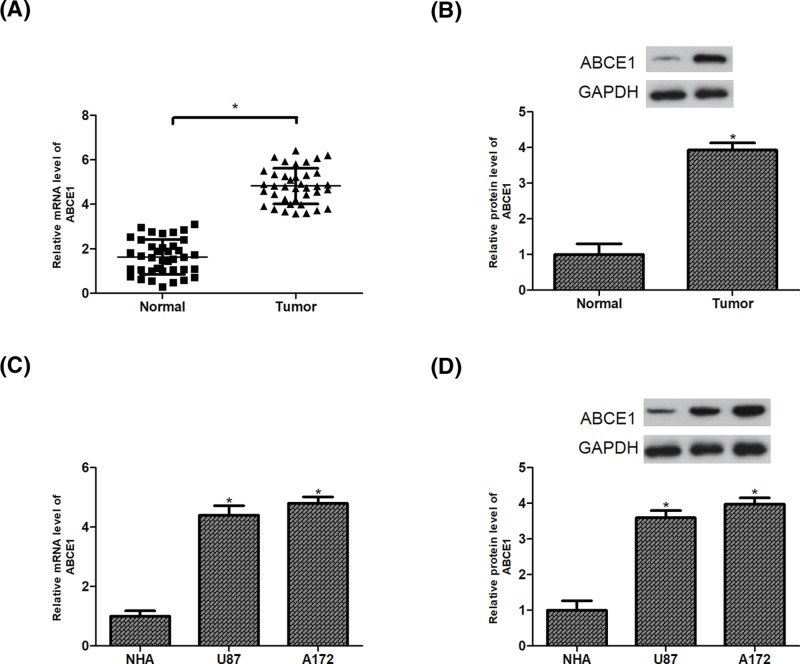
Figure 1. Expression of ABCE1 is elevated in glioma tissues and cell lines.
(A,B) Relative expression of ABCE1 was analyzed by RT-PCR and Western blot analysis in glioma tissues and matched adjacent normal tissues (n=38). (C,D) Relative ABCE1 expression levels were validated by RT-PCR and Western blot analysis in glioma cell lines (U87 and A172) in comparison with the NHA. *P<0.05.

