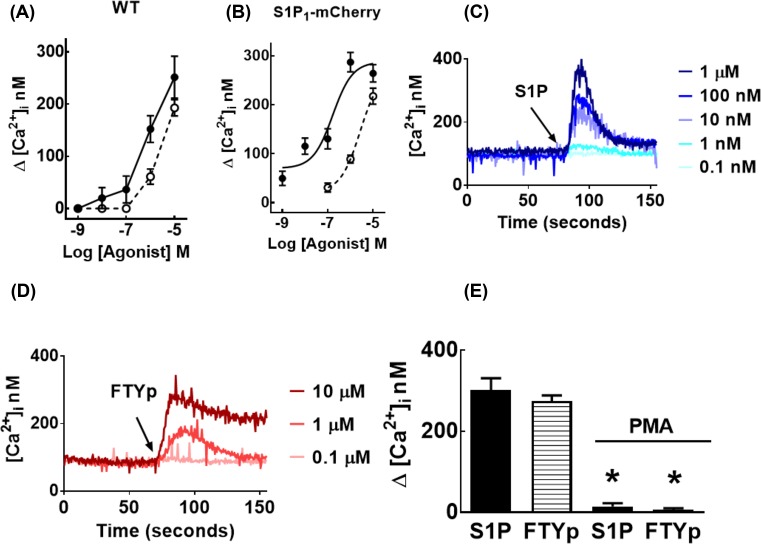
Figure 1. Effects of S1P, FTYp, and PMA on intracellular calcium concentration.
Untransfected (wild-type, WT; (A)) or mCherry-tagged S1P1 receptor-expressing (S1P1-mCherry; (B)) HEK 293 cells were treated with the indicated concentrations of S1P (closed circles, solid lines) or FTYp (open circles, dotted lines) and the maximal calcium concentration was recorded. Plotted are the means with vertical lines indicating the S.E.M. of three (A) or five (B) experiments performed with different cell cultures. All the remaining panels correspond to experiments using mCherry-tagged S1P1 receptor-expressing cells. Representative calcium tracings obtained in responses to different concentrations of S1P (C) or FTYp (D). In (E), cells were preincubated for 10 min in the absence or presence of 1 µM PMA and then challenged with 1 µM S1P or 10 µM FTYp. Plotted are the means with vertical lines indicating the S.E.M. of eight experiments performed with different cell cultures. *P <0.001 compared with absence of PMA.

