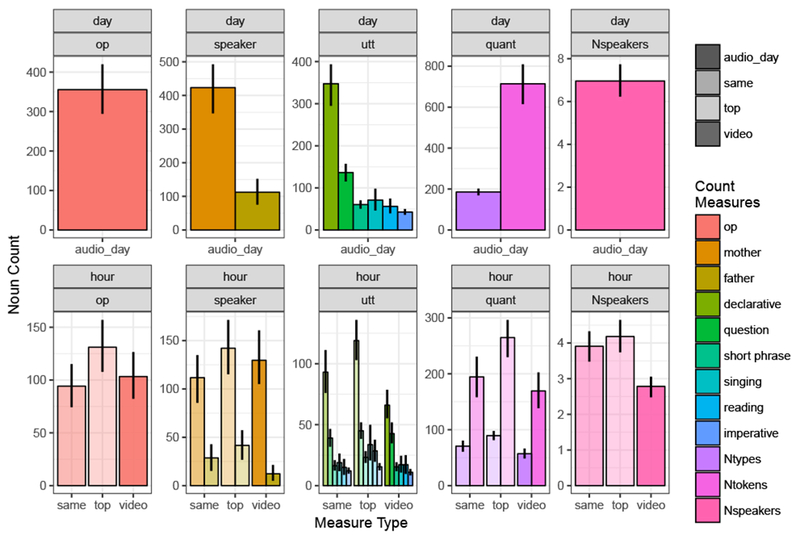
Figure 1.

Noun count measures across audio-recordings and videos. Top row depicts daylong audio data; bottom row shows the 3 hour-long annotations: “same” and “top” are the two peak audio times, and “video” indicates the video data. Upper panel labels indicate annotated sample length (day or hour); the bottom panel labels reflects measure type (op = object presence; utt = utterance-type, quant = quantity, Nspeakers = number of speakers). Bars (left to right) appear in legend order (top to bottom) in both color (count measures) and opacity (time sample: day, top-hour, same-hour, or video).
