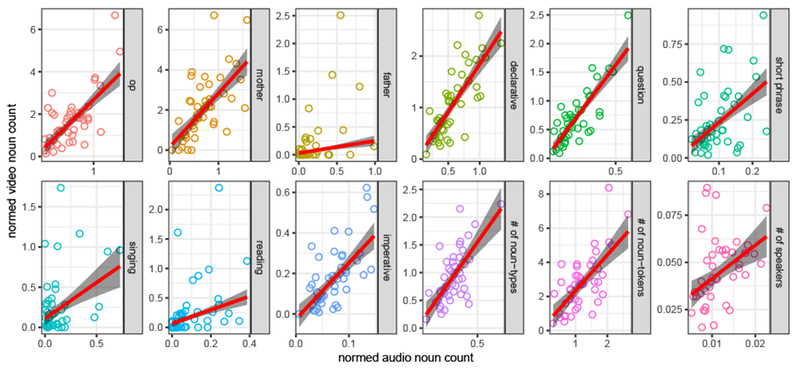
Figure 3.

Normalized count correlations between audio- vs. video-recordings. Each point indicates nouns per minute of recording for each child, averaged across months 6 and 7, for each measure. Point-shape indicates measure type. Robust linear correlations are plotted for visualization only; non-parametric correlations (Kendall) were computed for analysis, showing that all correlations were significant except nouns from fathers and in singing.
