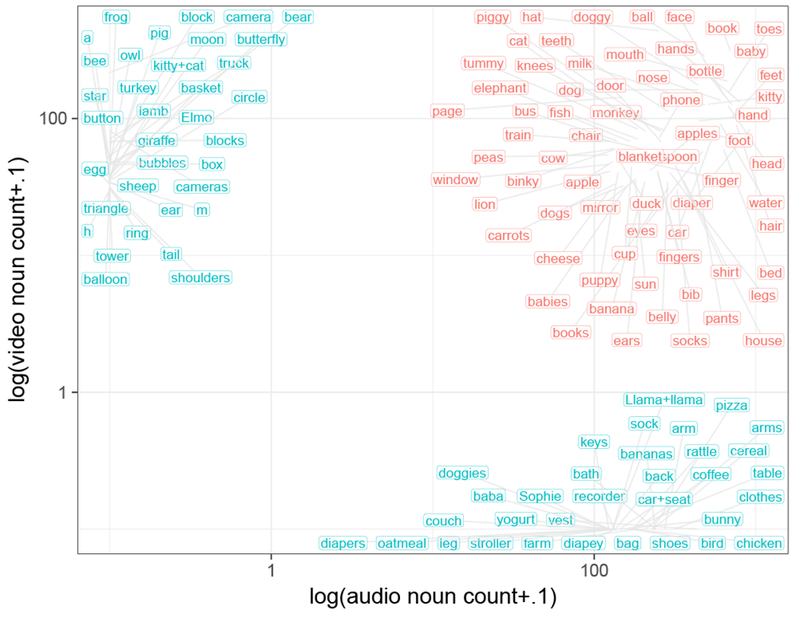
Figure 5.

Log-scaled counts of the top 100 words in audio- and video-recordings. Each node represents the averaged count, across all participants in both months, of each noun (0.1 was added before taking logs to include 0 counts.) Words in blue occurred 0 times in one recording type; words in pink were attested in both recording types. Nodes are jittered for visual clarity, with grey lines indicating node location on axes.
