Figure 7.

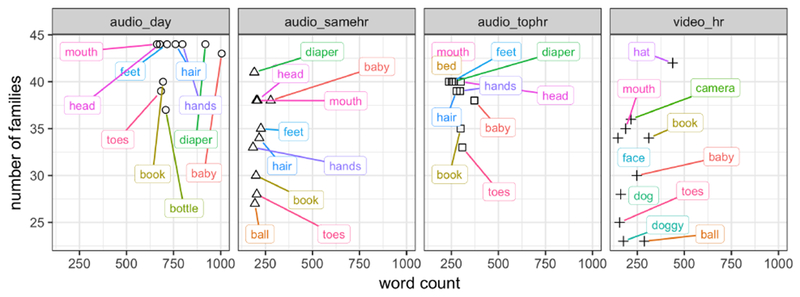
Top 10 words by recording type and time sample. Each node represents the frequency count of each top audio or video word over both months (x-axis) and the number of families where that word was said (out of 44) across months (y-axis).

Top 10 words by recording type and time sample. Each node represents the frequency count of each top audio or video word over both months (x-axis) and the number of families where that word was said (out of 44) across months (y-axis).