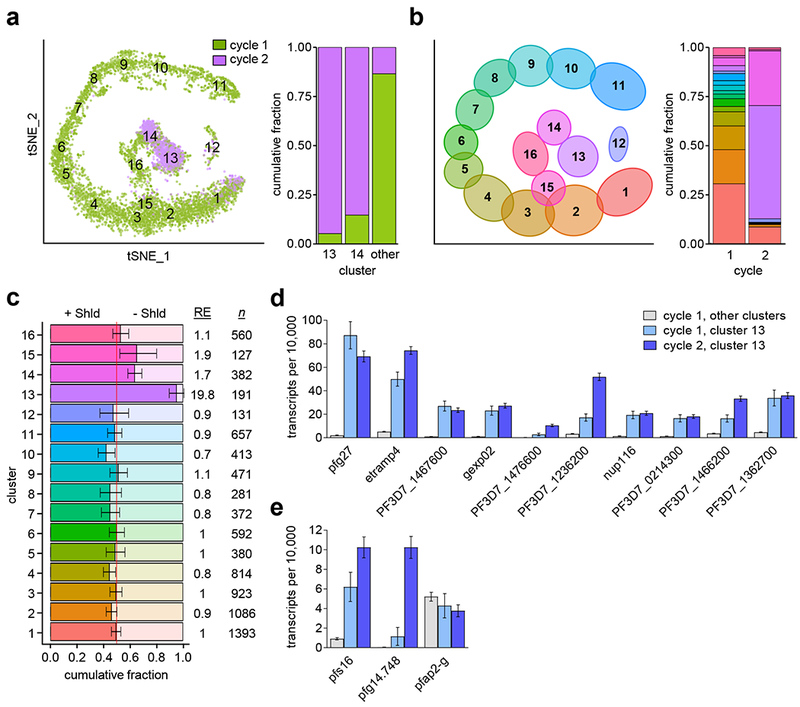
Figure 3. Single-cell RNA-seq identification and characterization of same cycle conversion (SCC) gametocytes.

a, Cluster analysis of previously published single-cell transcriptomics data from parasites of the E5-HA-DD line treated with Shld at ~4-16 h post-invasion (hpi) and isolated at ~30, ~36 or ~42 hpi of the same cycle (cycle 1) or at ~42 hpi of the next cycle (cycle 2, stage I gametocytes). See Supplementary Figure 6 legend for a detailed definition of tSNE axes. The plot at the right shows the proportion of parasites from cycle 1 and cycle 2 in selected clusters (normalized per number of cells in each sample) from the analysis of 7,472 cells (5,736 from cycle 1 and 1,736 from cycle 2). The cycle 1 versus cycle 2 composition of cluster 13, cluster 14, and the combined remaining clusters were all non-randomly distributed (all p<1×10⁻¹⁵, two-sided Exact Poisson test). b, Distribution of cells from cycle 1 (Shld-treated and untreated) and cycle 2 between the different clusters from the analysis of 10,509 cells. Cycle 1 values are normalized to account for the number of cells analyzed at each time point. c, Relative abundance of cycle 1 Shld-treated (bright shading) or untreated (pale shading) cells within each cluster. Abundance is normalized to account for the number of cells collected at each treatment condition. Numbers at the right show the relative enrichment for treated cells within each cluster (RE) and the number of cells in each cluster (n). Error bars indicate 95% confidence interval based on two-sided Exact Poisson test. d, Average expression of cluster 13 cycle 2 gametocyte markers (also see Supplementary Table 3 and Supplementary Fig. 6–7) shown for Shld-treated cycle 1 cells outside of cluster 13 (5,552 cells) or within cluster 13 (184 cells), and for Shld-treated cycle 2 cluster 13 cells (1,003 cells). Expression is normalized to 10,000 transcripts per cell. Mean and estimated 95% confidence intervals are shown. e, Same analysis for additional gametocyte markers.
