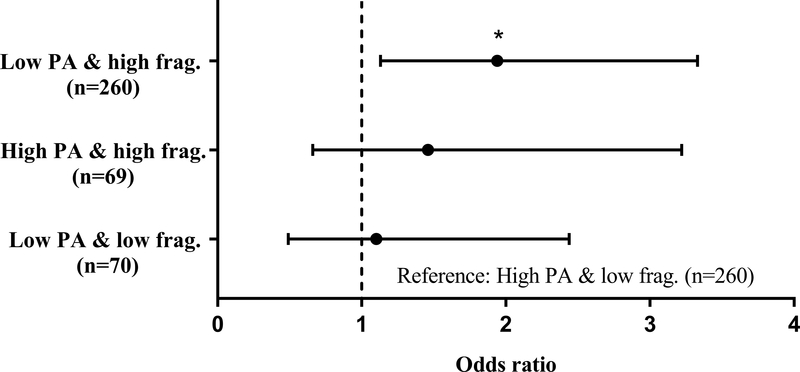
Figure 2.
Adjusted odds ratios of physical activity accumulation in those with cancer history compared to those without (reference), n=659
Note: PA – physical activity; frag. – fragmentation
Model adjusted for age, sex, race, body mass index (kg/m^2), employment, smoking history, usual gait speed (m/s), depressive-like symptoms and 2 or more comorbidities. *p<0.05

