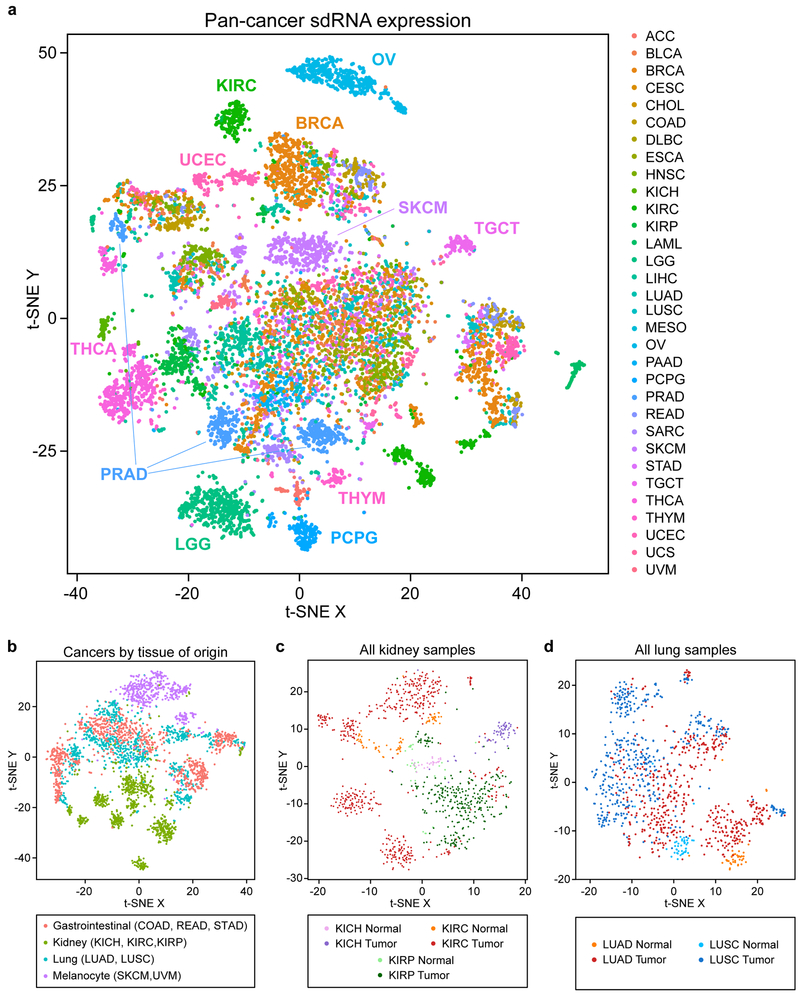
Figure 3: High dimensional pan-cancer patient clustering based on sdRNA expression signatures.
a. t-SNE plot of sdRNA expression in tumors from 32 different cancer types (n = 10,262), aggregated by parental snoRNA. Samples are colored by cancer type.
b. t-SNE plot of gastrointestinal, kidney, lung, and melanocyte derived cancers, colored by tissue of origin.
c. t-SNE plot of all normal kidney and kidney tumor samples.
d. t-SNE plot of all normal lung and lung tumor samples.

