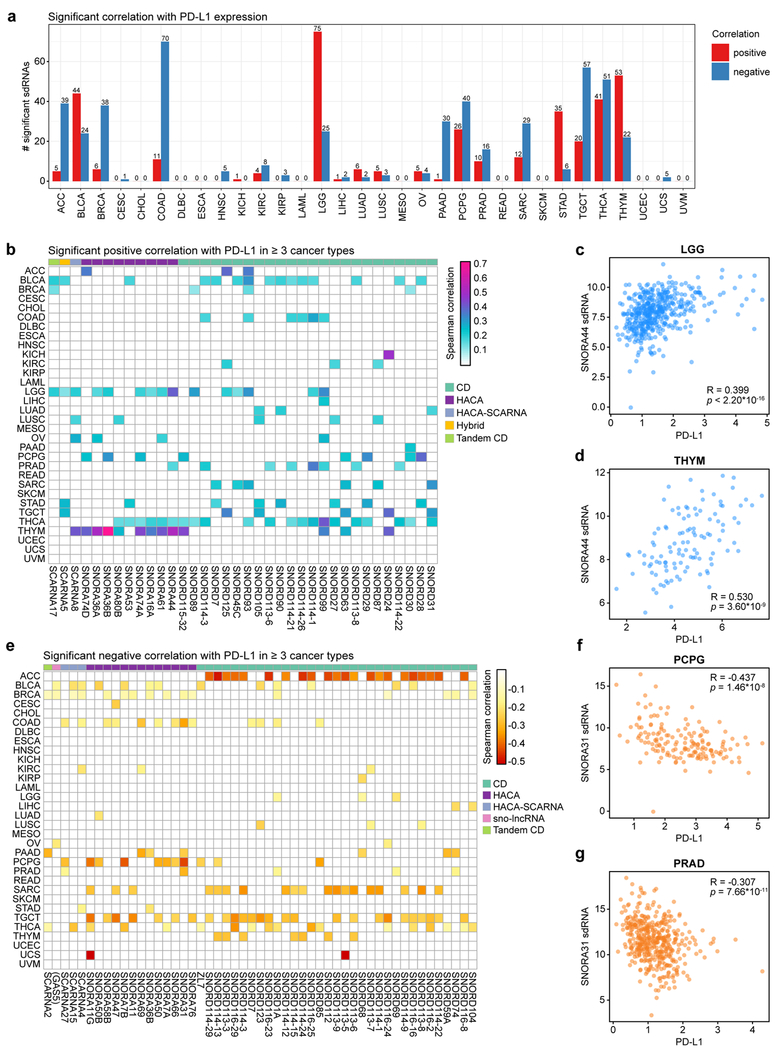
Figure 4: sdRNAs are correlated with PD-L1 expression in human cancers.
a. Bar plot depicting the number of significant sdRNAs in each cancer type, aggregated by parental snoRNA, in relation to PD-L1 expression. Red, positive correlation; blue, negative correlation.
b. Heat map of sdRNAs positively correlated with PD-L1 (CD274) expression (adjusted p < 0.05, adjusted within each cancer type). For visibility, only sdRNAs that were positively correlated in three or more cancer types are shown. Boxes are colored according to the Spearman correlation with PD-L1. Parental snoRNAs without annotated names are instead labeled by their host gene in parentheses. SnoRNA classifications are annotated on top based on a color legend on the right panel.
c. Scatter plot depicting the correlation between PD-L1 and SNORA44 sdRNA expression in lower grade gliomas (LGG, n = 453). Spearman correlation R = 0.399, p < 2.20 * 10-16.
d. Scatter plot depicting the correlation between PD-L1 and SNORA44 sdRNA expression in thymomas (THYM, n = 111). R = 0.530, p = 3.60 * 10-9.
e. Heat map of snoRNAs negatively correlated with PD-L1 (CD274) expression (adjusted p < 0.05, adjusted within each cancer type). For visibility, only sdRNAs that were positively correlated in three or more cancer types are shown. Boxes are colored according to the Spearman correlation with PD-L1. Parental snoRNAs without annotated names are instead labeled by their host gene in parentheses. SnoRNA classifications are annotated on top based on a color legend on the right panel.
f. Scatter plot depicting the correlation between PD-L1 and SNORA31 sdRNA expression in pheochromoytomas and paragangliomas (PCPG, n = 157). R = −0.437, p = 1.46 * 10-8.
g. Scatter plot depicting the correlation between PD-L1 and SNORA7B sdRNA expression in prostate adenocarcinoma (PRAD, n = 435). R = −0.307, p = 7.66 * 10-11.
c, d, f, g - Data are shown as tpm, normalized separately for mRNA-seq and smRNA-seq datasets.

