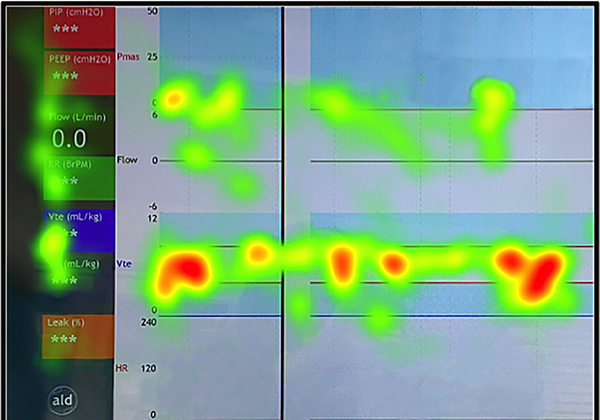
Figure 2:
Example heat map. Heat maps are a graphical representation of the mapped gaze data, where colors indicate the density of gaze fixations (density increases from green-yellow-orange-red). Here the heat map demonstrates the summary of all gaze points on the respiratory function monitor (RFM) recorded during the simulation. These are mapped onto an exported image of the RFM screen. The highest density of gaze fixations, indicated by the red color of the gaze point clusters, are seen overlying the exhaled tidal volume waveform region.

