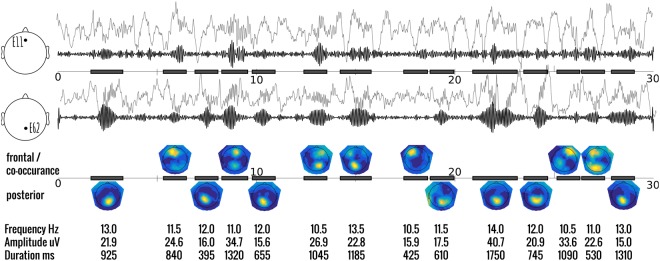
Figure 1.
Representative trace of multiple spindle events during 30 seconds of NREM sleep. The top 2 panels show the typical ‘raw’ EEG signal (elevated grey) and the wavelet filtered (10–16 Hz) signal (black) of a selected frontal-central channel (E11), and posterior-central channel (E62) where spindles are most typically found. Detected spindles are indicated with a black bar in the timeline. Keep in mind that the detected spindle may not have been found in either E11, or E62 (e.g. 8th and 12th example spindle. The third panel shows the topography of the mean spectral power over all detected spindles. Locations tend to be either frontal or posterior, with fewer occurring at both locations simultaneously. The bottom panel shows some of the individual parameters that can be assessed from the results of this automatic detection.

