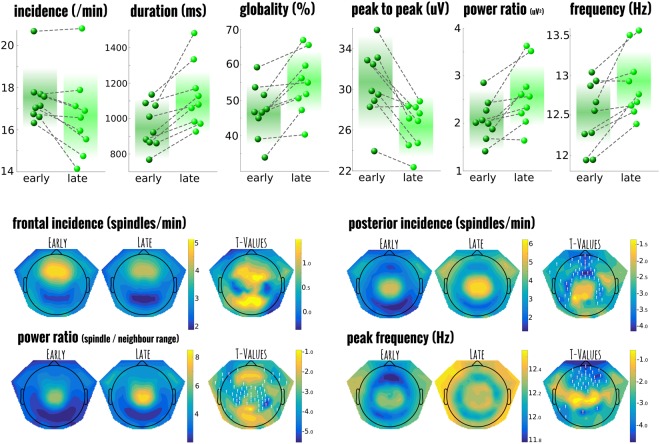
Figure 2.
Comparison between early night and late night spindles in healthy controls. Top panel shows the individual participant values for each of the selected spindle summary measures and how they change over the course of the night from the first to last cycle of sleep. The background colour indicates the mean value with fade out at 2 standard deviations. Notice that while the power of spindles (in ratio of spindle frequencies to its neighbours) increases across the night, the amplitude and incidence of individual spindles actually decreases while the duration and globality increase. All comparisons are significantly different from one another. The panels below the t-value topography of selected spindle measures and their statistical comparison; channels marked with a white ‘!’ are statistical different after correction for multiple comparisons.

