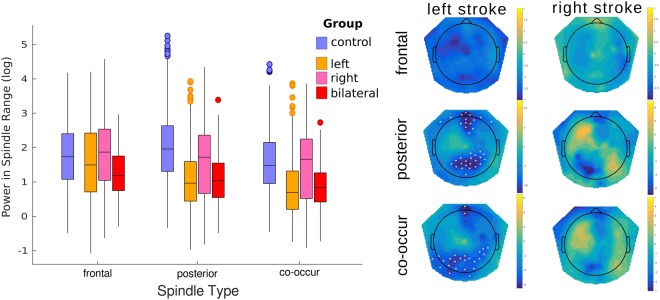
Figure 5.
The effect of paramedian thalamic stroke on individual spindle power. Left boxplots show the distribution of spindle power for each of the stroke locations relative to the elderly, age-matched control group for all individual spindles. Linear mixed model analysis showed a significant reduction in power for both the posterior and co-occurring spindles after left sided thalamic damage with no additional loss of power after right damage. Right panel shows the topographic distribution of the calculated parameter estimates from the model at the individual channel level. Channels marked with a white asterisks are considered statistically different after multiple comparisons correction using a permutation approach of the linear mixed model data.

