Figure 6.
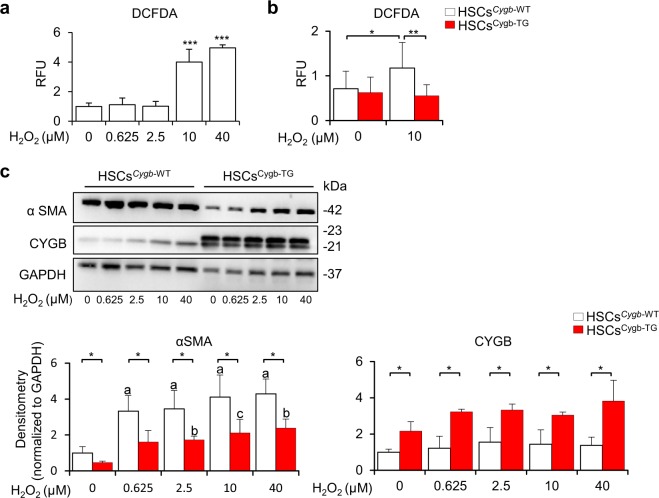
Overexpression of Cygb alleviated the ROS-induced activation of HSCs. DCFDA assay for HSCsCygb-WT treated with H2O2 in a dose-dependent manner (a), and comparison to HSCsCygb-TG at a specific concentration (10 μM) (b). RFU, relative fluorescence unit. (c) Immunoblot analysis of αSMA and CYGB in HSCsCygb-WT and HSCsCygb-TG under H2O2 exposure at different doses. Densitometric intensity was quantified. GAPDH was used as a loading control and for normalization. a, p ≤ 0.001 relative to non-treated HSCsCygb-WT; b, p ≤ 0.01 relative to non-treated HSCsCygb-TG; c, p ≤ 0.05 relative to non-treated HSCsCygb-TG. Full-length Western blots of one gel are presented in Supplementary Fig. S11. Values are given as the mean ± SD of all experiments. *p < 0.05, **p < 0.01, ***p < 0.001.

