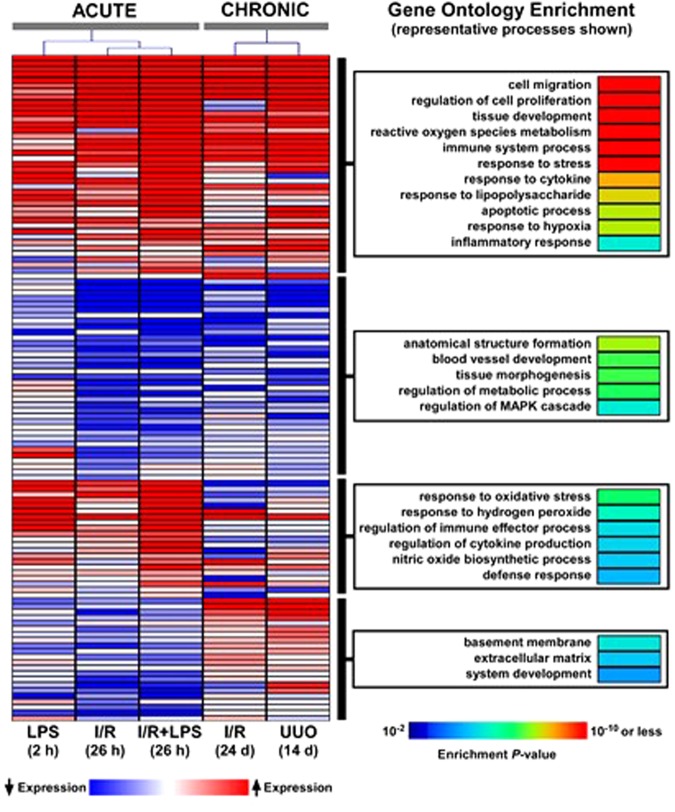
Figure 2.
Correspondence analysis of mRNA expression variability across 120 candidate genes in acute kidney injury (AKI) and chronic kidney disease (CKD). Total RNA from injured kidneys and controls (contralateral) kidneys (n = 6 mice) was used in RT reactions with oligo-dT primers. cDNA was used in real time qPCR with gene specific primers (120 genes, Table S1, Supplement). mRNA level of a given gene in each sample was normalized to ribosomal RNA protein L32. For each experimental condition, the mean gene expression values from n = 6 mice were used for correspondence analysis. The analysis was based on assessing whether variability in gene expression across the experimental conditions distinguishes AKI models (magenta) from CKD models (green). Separation along each axis indicates differences in gene expression variability, with the first axis capturing the largest differences. As seen in the figure, AKI and CKD models segregated distinctly (axis 1), implying profound alterations in transcriptional signal between these two conditions. However, we also observed separation within the AKI models (axes 2 and 3) indicating gene expression variability between these acute renal injury conditions.

