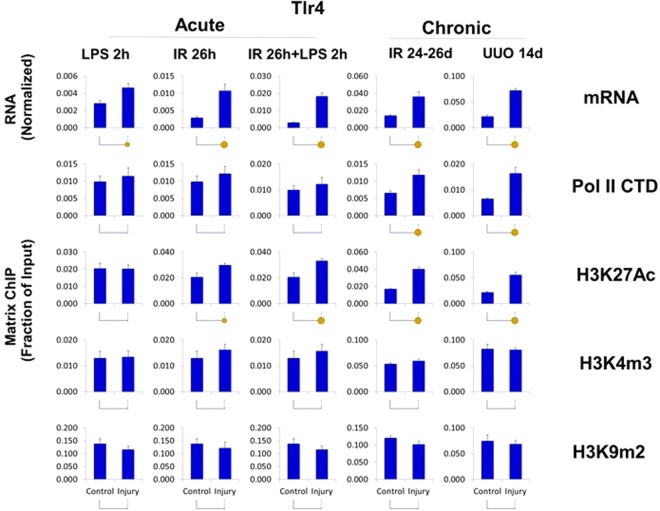
Figure 6.
Transcriptional and epigenetic analysis of Tlr4 gene in AKI and CKD models. RT-qPCR RNA and ChIP-qPCR analysis (see Fig. 4). Tlr4 transcript levels (mRNA) were normalized to L32 mRNA. Matrix ChIP-qPCR analysis of RNA polymerase II (Pol II), and permissive (H3K27Ac, H3K4m3) and repressive (H3K9m2) marks (n = 6 mice from each group). Small solid circle, p < 0.05, large circle, p < 0.01, and no circle, not statistically significant. The upregulated Tlr4 mRNA was matched by increased in Pol II levels in CKD and less so in AKI, where in the latter post-transcriptional processes maybe also playing a role.

