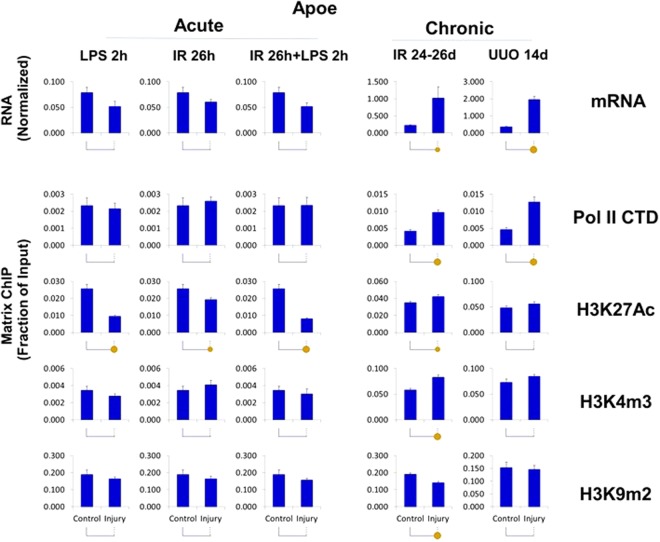
Figure 8.
Transcriptional and epigenetic analysis of Apoe gene in AKI and CKD models. RT-qPCR RNA and ChIP-qPCR analysis (see Fig. 4). Apoe transcript levels (mRNA) were normalized to L32 mRNA Matrix ChIP-qPCR analysis of RNA polymerase II (Pol II), and permissive (H3K27Ac, H3K4m3) and repressive (H3K9m2) marks (n = 6 mice from each group). Small solid circle, p < 0.05, large circle, p < 0.01, and no circle, not statistically significant. Apoe was upregulated in CKD but not AKI. The corresponding increase in Pol II and permissive marks and decreased repressive mark indicate that the upregulation is transcriptionally and epigenetically mediated.

