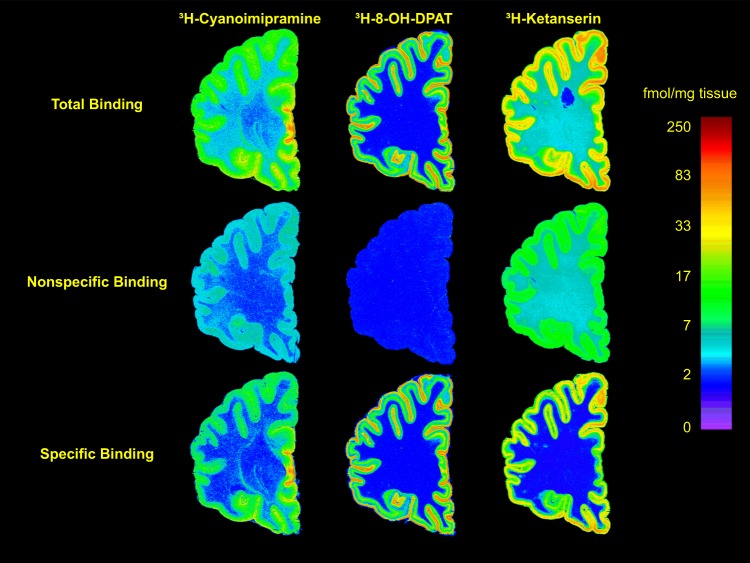
Fig. 1. Representative autoradiograms of receptor binding of [3H]-Cyanoimipramine to the serotonin transporter (left), [3H]-8-OH-DPAT to the 5-HT1A receptor (center) and [3H]-Ketanserin to the 5-HT2A receptor (right).
The autoradiograms are from sections cut from the right hemisphere of a representative nonpsychiatric control. The upper row has images of total binding, the middle row is of nonspecific binding and the lower row has subtracted images of specific binding. See methods for displacers and assay conditions. The images were calibrated to fmol/mg tissue using radioactivity standards and color-mapped to a single scale on the right

