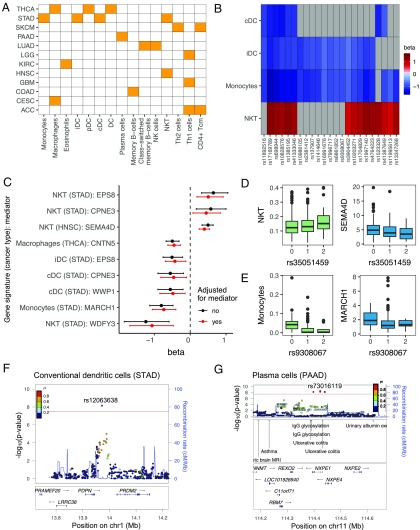
Fig. 5.
TCGA tumor immune cellularity gsQTLs. (A) Heat map showing gene signatures (x axis) with one or more significant gsQTLs and the cancer type(s) (y axis) in which they were shown to be statistically significant (P < 2.1 × 10⁻⁸). Definitions of cancer types are provided in Table 1. Cancer types without any significant gsQTLs were not shown. (B) Heat map showing gsQTLs associated with two or more of the following gene signatures: cDCs, iDCs, monocytes, and NKT cells (in STAD). The color represents the effect size (β) of the association. Gray boxes are nonsignificant associations. (C) Forest plot showing significant mediator genes for the gsQTL-gene signature associations. The dots represent the effect sizes (β) of the gsQTL-gene signature associations before (black) and after (red) adjusting for the expression of the mediator genes. The error bars represent confidence intervals. (D, Left) Boxplot showing NKT cell gene signature scores stratified by genotypes of its associated gsQTL, rs35051459. (D, Right) Boxplot showing the expression of the mediator gene SEMA4D [log2 normalized read per kilobase of transcript per million mapped reads (nRPKM)] stratified by genotypes of the same gsQTL. (E, Left) Boxplot showing the monocyte gene signature scores stratified by genotypes of its associated gsQTL, rs9308067. (E, Right) Boxplot showing the expression of the mediator gene MARCH1 (log2 nRPKM) stratified by genotypes of the same gsQTL. (F) LocusZoom plot for the cDC gene signature in STAD. The gsQTL rs12063638 is located downstream of the PDPN gene. cMMb, centimorgan per megabase; chr, chromosome. (G) LocusZoom plot for the plasma cell gene signature in PAAD. The gsQTL rs73016119 is located in the same LD block as GWAS risk loci for ulcerative colitis.

