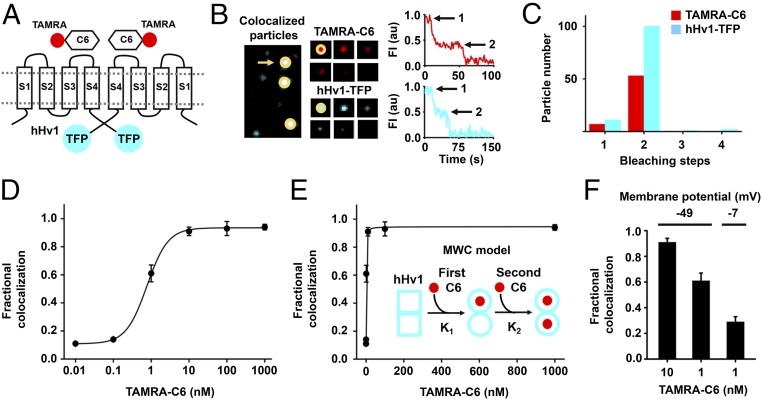
Fig. 2.
C6 binds to cell surface hHv1 channels potently and cooperatively. C6 peptide was synthesized and labeled with red fluorophore carboxy-tetramethylrhodamine (TAMRA-C6) and studied with hHv1 tagged with teal fluorescent protein (hHv1-TFP) in HEK293T cells by smTIRF microscopy as described in Materials and Methods. (A) Cartoon showing two TAMRA-C6 peptides binding on two subunits of an hHv1-TFP–tagged channel. (B, Left) Incubation of TAMRA-C6 (red) with heterologous expressed hHv1-TFP (teal) results in single colocalized particles (white) with both TAMRA and TFP fluorescence at the surface of cells. (B, Center) Montage of photobleaching time course of a single fluorescent particle (indicated by arrow in Left), during continuous excitation to bleach the fluorophores. Every fifth frame is shown. (B, Right) Time courses for simultaneous photobleaching of both fluorophores in the representative colocalized particle, showing two stepwise changes in fluorescence intensity for hHv1-TFP and TAMRA-C6 (arrows). (C) Histogram of photobleaching steps for hHv1-TFP (teal bars) simultaneously photobleached with 1 nM TAMRA-C6 (red bars). Eighty-eight percent of studied particles with hHv1-TFP were bleached in two steps. The data analyzed by the approach of Hines estimate hHv1 channels in surface particles formed with two subunits, with an estimated confidence of >0.999 (SI Appendix, Table S2). Among all colocalized particles containing both fluorescent colors, 88% have two TAMRA-C6 bleaching steps at 1 nM TAMRA-C6 (Table 1). (D) Titration with increased concentration of TAMRA-C6 onto hHv1-TFP results in increasing fractional colocalized fluorescent particles quantitated using mean MCC. The dose–response is fitted to Hill relationship to obtain a dissociation constant Kd = 0.75 ± 0.03 nM with a Hill coefficient of 1.52 ± 0.13. Each data point represents the mean ± SEM for three to five cells studied in each condition. (E) Dose–response for hHv1 titrated with TAMRA-C6 at increasing concentrations was fitted to allosteric Monod–Wyman–Changeux (MWC) model (Inset). In the model, the first C6 binds to one subunit of hHv1 with equilibrium association constant K1. Binding of C6 converts hHv1 subunits from state □ to the ○ state. The second C6 binds to the other subunit with equilibrium association constant K2. Fitting yields K1 = 3.74 ± 1.12 nM, K2 = 0.31 ± 0.07 nM, and gives an allosteric equilibrium constant L0 = 9.50 ± 0.99. The ratio of K2/K1 is 12. When performing nonlinear curve fitting, an adjusted r-square value can be obtained for estimating the goodness of fit. The closer the fit is to the data points, the closer r-square will be to the value of 1. For fitting with MWC model, an adjusted r-square value of 0.9977 was obtained. (F) The colocalization of TAMRA-C6 with hHv1 decreases with membrane depolarization. At a RMP of −49.1 ± 3.6 mV, the mean Manders’ coefficient of colocalization of TAMRA-C6 was 0.91 ± 0.03 at 10 nM, and this decreased to 0.61 ± 0.06 when 1 nM was applied (Table 1). When the RMP increased to −7.4 ± 0.9 mV (by changing bath KCl), 1 nM TAMRA-C6 yielded a Manders’ coefficient of 0.29 ± 0.04, corresponding to an approximately threefold decrease in toxin affinity.

