Fig. 3.
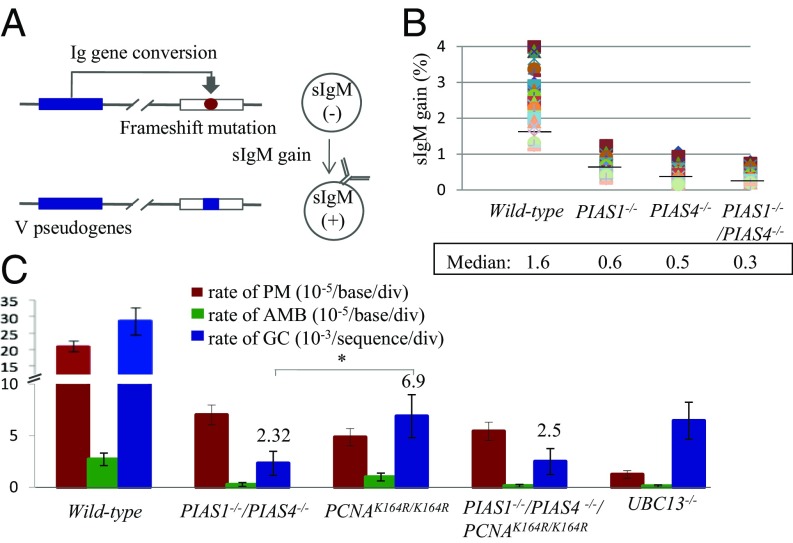
Analysis of the Ig GC rate in DT40 B cell clones. (A) Diagram of the Ig GC assay. The frameshift mutation caused by the insertion of G in the rearranged Vλ segment in the parent cells is indicated by the red circle. GC events using an upstream ΨV donor segment can eliminate the frameshift mutation, resulting in a gain in sIgM expression. The ΨV segment is indicated by the blue box. (B) The proportion of sIgM-positive cells was determined in 36 parallel cultures derived from single sIgM-negative parental cells after clonal expansion (3 wk). Median percentages are noted below each data set. (C) Rates of Ig GC and nontemplated mutation in AID-expressing clones carrying the indicated genotypes. The y axis represents the rate of nontemplated mutations (10−5/base/div), ambiguous mutation (10−5/base/div), and gene conversion (10−3/sequence/div). The error bars indicate SEM. Statistical analyses were performed by Student’s t test (*P < 0.01).

