Fig. 5.
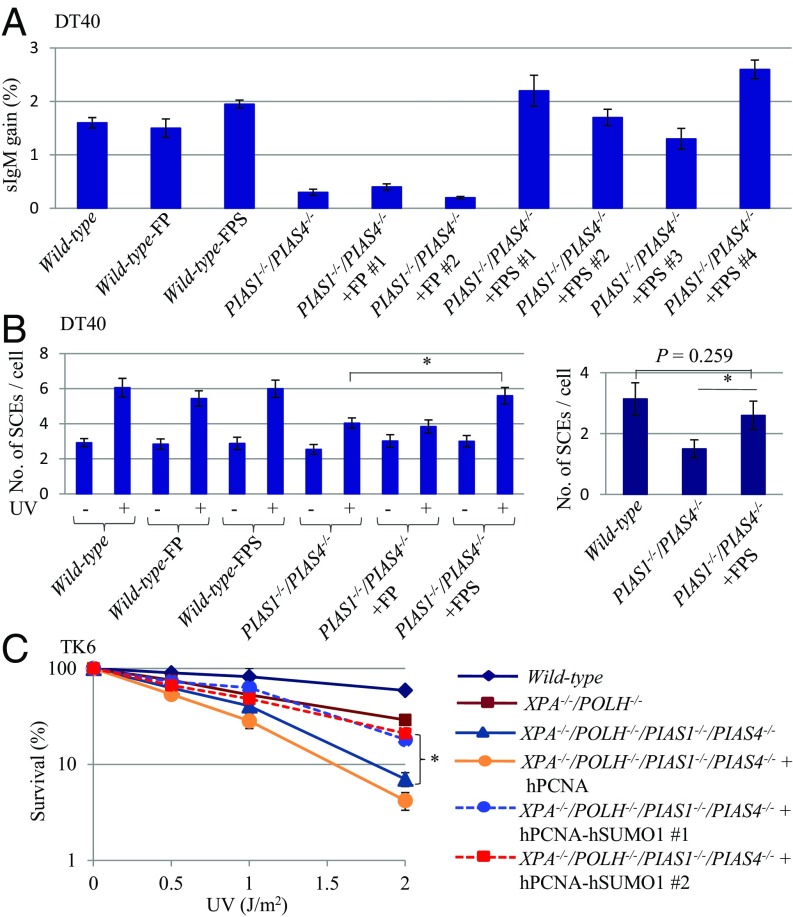
Ectopic expression of hPCNA-hSUMO1 reverses the mutant phenotype of PIAS1−/−/PIAS4−/− cells. (A) The proportion of sIgM-positive DT40 cells was determined as in Fig. 3B. The error bars indicate SEM. (B) The number of SCEs induced by 0.25 J/m2 UV in the DT40 cells was determined as in Fig. 1A. The error bars indicate SEM. (C) Clonogenic cell survival assay following exposure of hPCNA-hSUMO1 expressing XPA−/−/POLH−/− and PIAS1−/−PIAS4−/−/XPA−/−/POLH−/− TK6 cells to UV. The x axis represents the dose of the indicated DNA-damaging agent on a linear scale; the y axis represents the survival fraction on a logarithmic scale. The error bars indicate SD. FP: Flag-hPCNA. FPS: Flag-hPCNA-hSUMO1. Statistical analyses were performed by Student’s t test (*P < 0.01).

