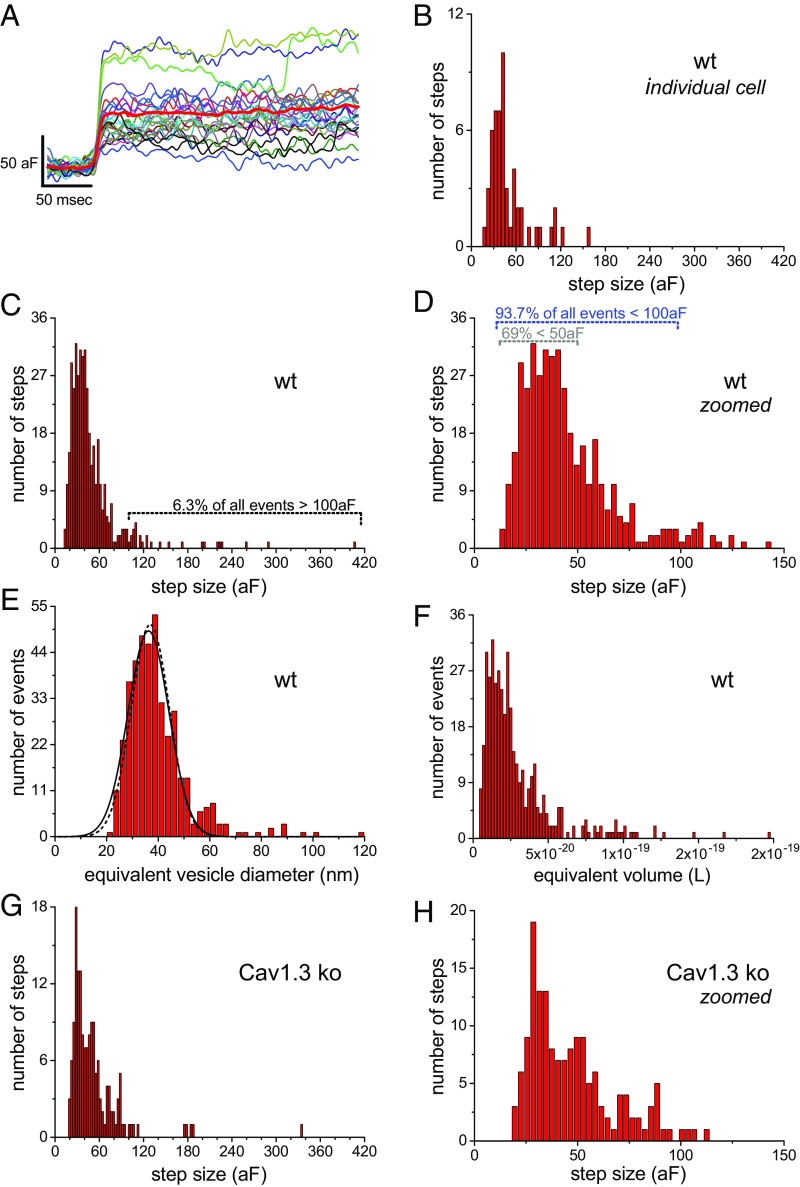
Fig. 4.
Fusion event amplitudes fall within the range of SVs common to IHCs. (A) Fusion events from a wild-type (wt) cell are aligned to their rising phase (average: thick red line). (B) Fusion event amplitude distribution for the patch in A. (C) Full range of wild-type event amplitudes. (D) Zoomed view of C. (E) Transformation of wild-type event amplitudes into full range of equivalent vesicle diameters (solid line is the Gaussian fit to equivalent diameter data; dashed line is SV diameter from EM; ref. 33). (F) Plots the full range of calculated vesicle volumes. (G) Full range of fusion event amplitudes recorded from Cav1.3 ko IHCs. (H) Zoomed view of G.

