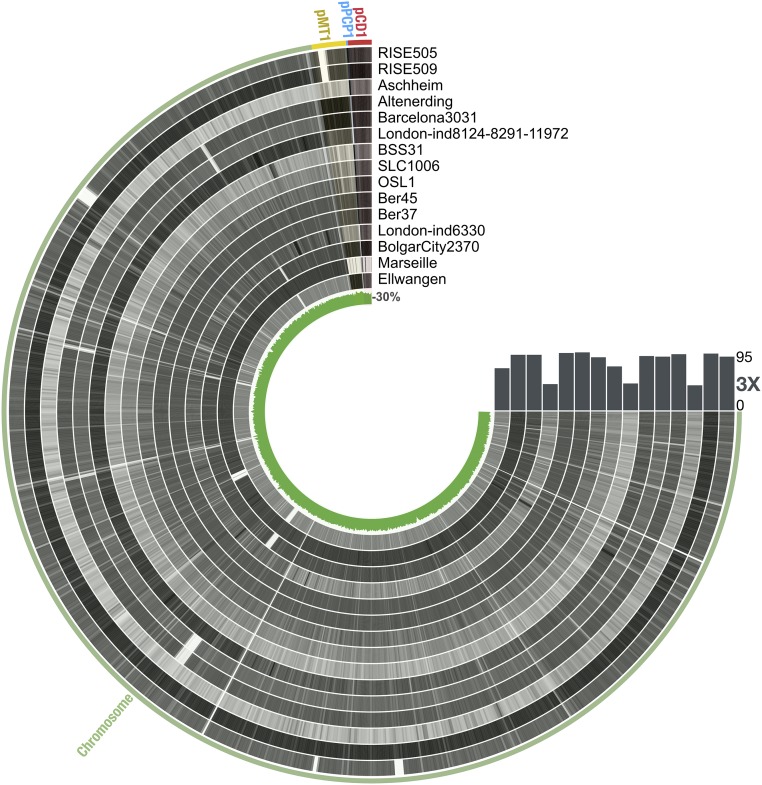
Fig. 2.
Overview of the coverage of ancient Y. pestis genomes. Each ring corresponds to one ancient genome. The color intensity is proportional to the coverage across the chromosomal genome and plasmids. The coverage rate, as well as the GC content, was measured throughout the genome using a window size of 200 bp. The bars indicate the fraction of the genome with a depth of coverage of 3×. This figure was generated using anvio (69).

