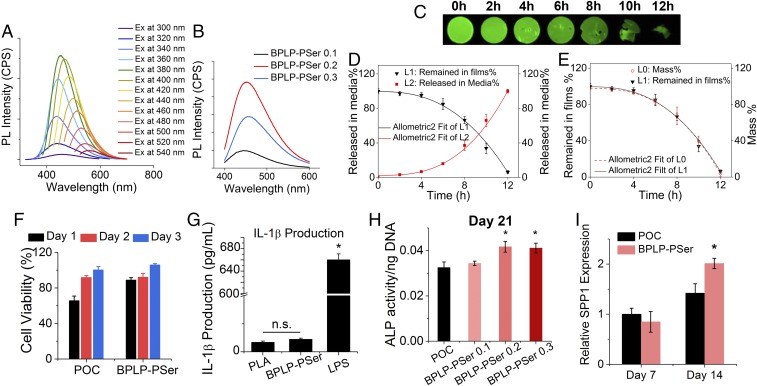
Fig. 4.
BPLP-PSer as a biocompatible photoluminescent biodegradable polymer. (A) Emission spectra of BPLP-PSer-0.2 prepolymer displaying tunable emission wavelengths by changing the excitation wavelength. (B) Emission spectra of BPLP-PSer prepolymer solutions with various molar ratios of PSer excited at 370 nm. (C) Fluorescent images of BPLP-PSer films after accelerated degradation for a predetermined time (0, 2, 4, 6, 8, 10, or 12 h) in 0.05 M NaOH solution. (D) Quantitative analysis of the remaining fluorescent signal in BPLP-PSer films (L1) and the corresponding fluorescent signal in degradation medium released from polymer films (L2). (E) Comparison of the remaining-fluorescence profile of BPLP-PSer films (L1) with the conventional mass-remaining profile (L0). In C–E, n = 5 films per time point. (F) Cytotoxicity test on leachable extracts from polymer films. L929 cells examined by Cell Counting Kit-8 (CCK-8) show significantly greater cell viability in the BPLP-PSer group than in the POC group. (G) Release of inflammatory factor IL-1β from THP-1 monocytes activated by incubation with polymer films, determined by ELISA. (H) ALP production of differentiating hMSCs cultured in OG medium on polymer films. BPLP-PSer 0.1/0.2/0.3 indicates 0.1, 0.2, or 0.3 molar ratios of PSer to citrate. (I) Expression of SPP1 encoding OPN by differentiating hMSCs cultured on polymer films in OG medium. Data are shown as the relative expression of SPP1 after normalization to the corresponding control group without citrate supplementation at day 7 (set to 1). In F–I, n = 3–5 biological replicates per group. All data are presented as mean ± SD; *P < 0.05; n.s., not significant.

