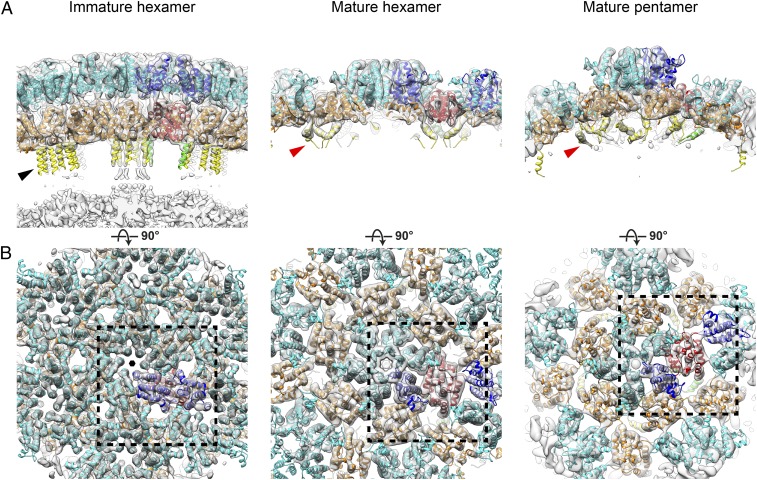
Fig. 2.
Structures of the CA region determined from immature and mature MLV virus particles by subtomogram averaging. (A) Cryo-ET density (gray) for CA lattice viewed tangentially. The isosurface level is set to allow fewer ordered parts of CAH and NC layer to be observed. The structural model is fitted and colored (NTD in cyan, CTD in orange, CAH in yellow). One CA dimer is highlighted by coloring the respective domains blue, red, and green. The CAH is marked by a black arrowhead (immature six-helix bundle) and a red arrowhead (mature, three helices on threefold axis). (B) As in A, but viewed from outside the Gag lattice. Black rectangles with dashed lines indicate regions shown at higher magnification in Fig. 3. The features shown in this figure are also illustrated in Movie S1.

