Fig. 2.
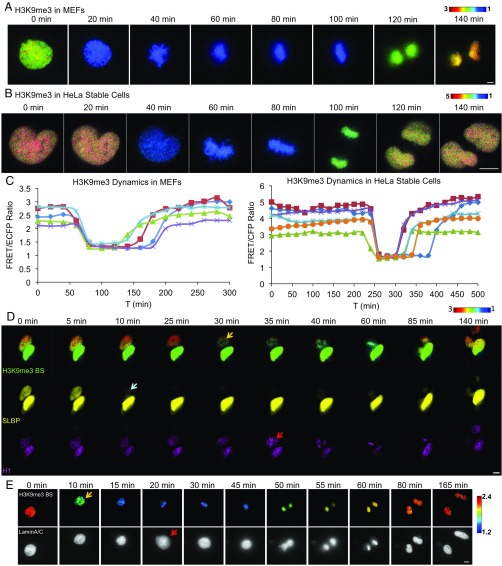
The dynamic nature of H3K9me3 during mitosis. (A) FRET/ECFP ratio images of the H3K9me3 biosensor in a representative MEF going through mitosis. The MEFs were transiently transfected with the H3K9me3 biosensor plasmid. (B) FRET/ECFP ratio images of the H3K9me3 biosensor in a representative HeLa cell going through mitosis. The CRISPR-generated stable HeLa cells were used for dynamic tracking. (C) Time courses of the raw FRET/ECFP ratio of the H3K9me3 biosensor in MEFs (Left; n = 5) and in HeLa cells (Right; n = 6) going through mitosis. (D) Tracking of cell cycle stages in HeLa cells via time-lapse imaging of H3K9me3 biosensor (H3K9me3 BS, ratiometric images; Upper), mOrange2-SLBP (SLBP, yellow; Middle), and H1-mMaroon1 (H1, purple; Lower). The arrow in each channel indicates the time of changes of the corresponding signals. (E) The FRET/ECFP ratio images (Upper row) and mCherry fluorescence images (Lower row) in HeLa cells expressing H3K9me3 biosensor and mCherry-LaminA/C. Arrows indicate the time points of the histone demethylation and the laminA/C dissolution. The color bars represent the range of emission ratio of H3K9me3, with cold and hot colors indicating low and high levels, respectively. (Scale bar, 10 μm.)

