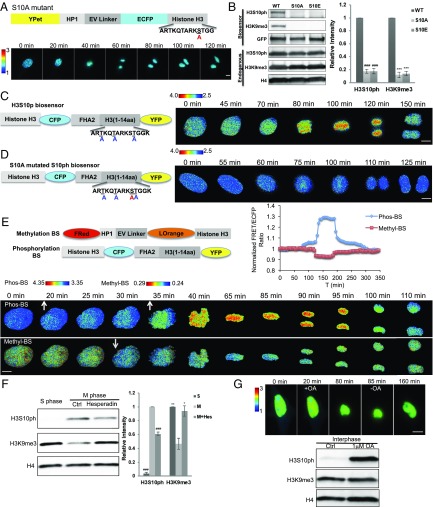
Fig. 3.
An overall anticorrelation between methylation and phosphorylation during mitosis visualized by dual FRET imaging. (A) A schematic drawing of S10A mutant of H3K9me3 biosensor and its ratiometric images in MEFs. (B) (Left) Western blot analysis of H3S10p and H3K9me3 of the H3K9me3 biosensor (WT) and its S10A or S10E mutant, as well as the endogenous H3 in HEK 293T cells. (Right) Bar graphs represent the mean ± SEM of the H3S10p and H3K9me3 signals. ###P < 0.001, ***P < 0.001, compared with WT group (Student’s t test, n = 3). (C and D) (Left) A schematic drawing of the H3S10p biosensor (C) or its S10A mutant (D). (Right) The corresponding FRET/ECFP ratio images of the biosensors obtained from a HeLa cell going through mitosis. (E) Schematic drawings of the domain structures of H3K9me3 and H3S10p biosensors for dual FRET imaging (Upper Left). The time courses of the emission ratio of H3S10p (blue) and H3K9me3 (red) biosensors in a single HeLa cell (Upper Right). (Lower) The FRET/ECFP ratio images of H3S10p (Phos-BS; Upper) and H3K9me3 biosensor (Methyl-BS; Lower) in a single representative HeLa cell going through mitosis. (F) (Left) Western blot analysis of endogenous H3S10p and H3K9me3 from double thymidine-synchronized (S-phase) or nocodazole-arrested (M-phase) HeLa cells with or without 200 nM hesperadin treatment. (Right) Bar graphs represent mean ± SEM of the H3S10p and H3K9me3 signals. ###P < 0.001, *P < 0.05, **P < 0.01, compared with the M-phase control group (Student’s t test, n = 3). (G) (Upper) The representative FRET/ECFP ratio images in an interphase HeLa cell expressing H3K9me3 biosensor before and after 1 μM Okadaic Acid (OA) treatment followed by its washout. (Lower) The corresponding endogenous H3S10p and H3K9me3 levels were analyzed by Western blot for interphase HeLa cells treated with DMSO (Ctrl) or 1 μM OA. The color bars represent the range of emission ratio, with cold and hot colors indicating low and high levels of H3K9me3, respectively. (Scale bar, 10 μm.)

