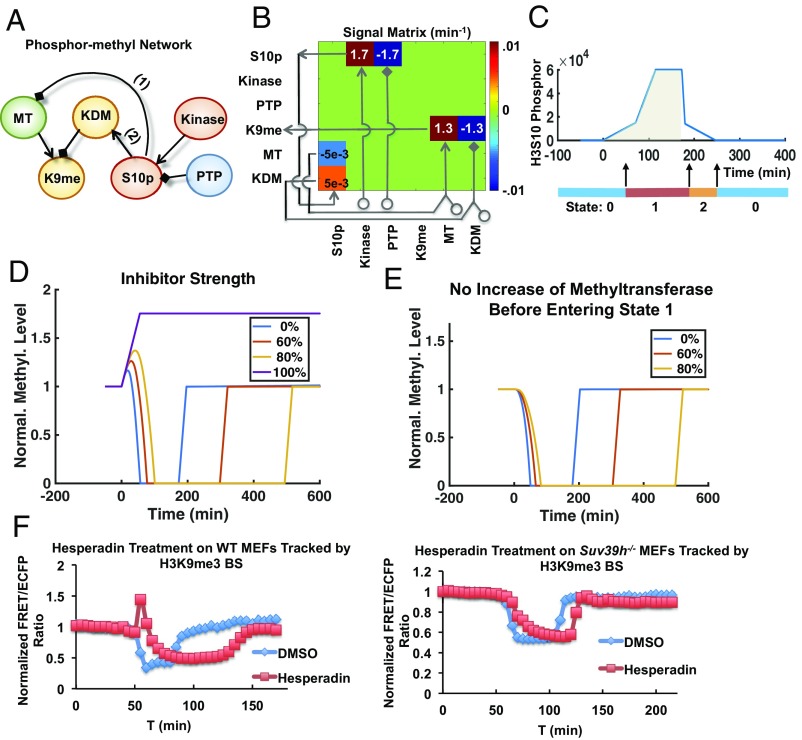
Fig. 5.
A mathematic model depicting the dynamic coupling of H3K9me3 and H3S10p. (A) The model describes a time-evolving signaling network containing H3K9me3 (K9me), H3S10p (S10p), methyltransferases (MT), demethylase (KDM), serine kinases (Kinase), and phosphatase (PTP). Positive and negative regulations are indicated by the shapes of arrow and diamond, respectively. Numbers 1 and 2 represent the pathways to be perturbed in coupling H3K9me3 and H3S10p. (B) The stoichiometric matrix shown is used to evolve the piecewise linear ordinary differential equation (ODE) system in time, with the values of all nonzero entries indicated. (C) The model is separated into three states: 0 for interphase, 1 for entering mitosis and mitosis, and 2 for exiting mitosis. After the H3S10 phosphorylation reaches an initial threshold (at ∼50 min), the cell switches to state 1 and enters mitosis. The cumulative phosphorylation level is calculated in the shaded area. After the accumulated phosphorylation exceeds a second threshold value, the phosphorylation level decreases, and cell switches from state 1 to 2. (D) The simulated level of H3K9me3 in cells with 0–100% blockages of H3S10p. (E) Simulation of the H3K9me3 dynamics as shown in D but without methyltransferase. (F) Time courses of normalized FRET/ECFP ratio of H3K9me3 biosensor in double thymidine-arrested WT (Left) and Suv39h−/− MEFs (Right) treated with DMSO and 50 nM hesperadin. Hesperadin was added to the culture 1 h before imaging started.

