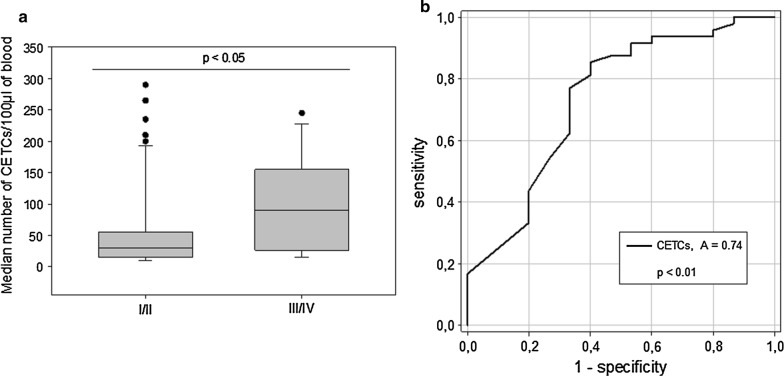
Fig. 3.
Number of CETCs in early (I/II) and advanced stage of disease (III/IV). a Box plot shows the number of CETCs in early and advanced stage of disease. Patients in advanced stage had significantly more CETCs as compared to patients in early stage of disease, *P < 0.05. b Determination of the cut-off point of CETC numbers by ROC curve analysis. ROC curve analysis was performed to determine the cut-off point of CETC numbers in terms of accuracy for discrimination of localized and advanced stage of disease. The value with the highest sum of sensitivity and specificity was chosen as a cut-off point: CETC number > 80 was determined as high CETC level and < 80 was determined as low CETC level. The AUC was 0.74, **P < 0.01

