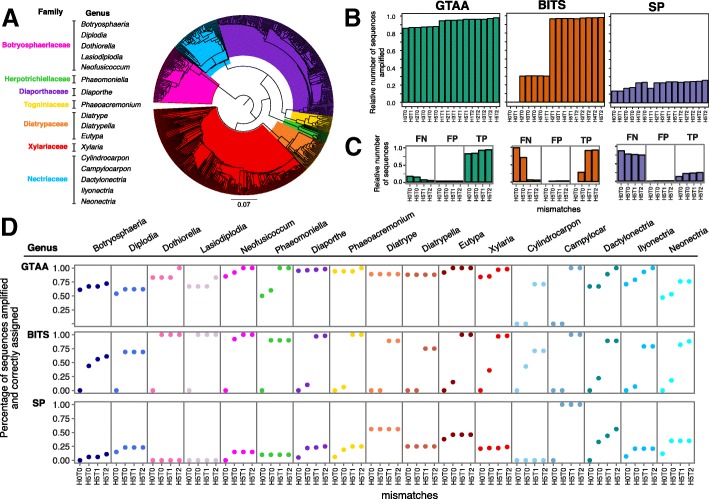
Fig. 2.
In silico simulation of amplification and taxonomic assignment. a Neighbor-joining tree of the full-length ITS sequences included in the custom database used in the simulation. b Barplots showing the number of sequences predicted to be amplified by each primer set at different combinations of mismatches. H: primer head. T: primer tail. Numbers correspond to the number of mismatches either in H or T. c Barplots showing the number of false negative (FN), false positive (FP), and true positive (TP) sequences with each primer set. d Percentage of sequences per genus correctly assigned with each primer set at the different mismatch combinations

