Fig. 1.
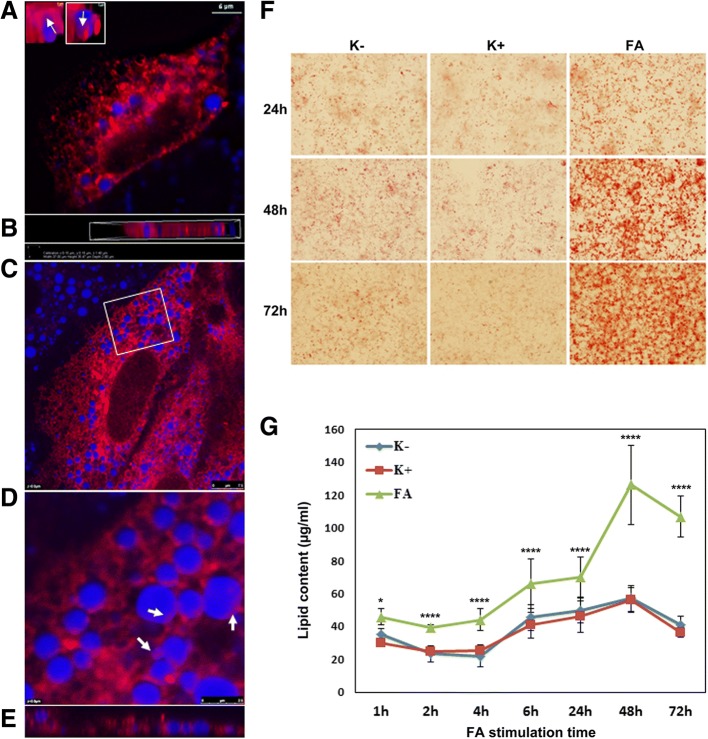
ER stress induced LD formation and quantification of intracellular hepatic lipid content in HepG2 cells. a & b Depicted are HuH7 cells transfected with ds RED calreticulin. The cultures were treated with 10 μM DTT for 24 h. The lipid droplets were stained with the fluorophore MDP (blue) and live cell images were captured with the TiE Nikon microscope. The images were analyzed with the NIS elements software version 4.13 and images in the inset are single LDs. Regions in pink (as indicated by arrows) appear to be associate with ER. The scale bar is 6 μm. Panel B is a view of panel A in x-y-z plane. c-e Fatty acid induced ER stress. Depicted are live cell images of HuH7 cells transfected with ds RED calreticulin. The cultures were treated with 1:1 equal mixture of oleic acid (OA) and palmitic acid (PA) for 24 h. The images were captured using a Leica SP5 confocal microscope. The scale bar is 7.5 μm. Panel D is a zoomed image of the rectangular marked region shown in panel C and panel E depicts the Y-plane of the white dotted line shown in panel D. The arrows indicate the region where LDs appear to be associated with ER. f Phase contrast images of intracellular lipid droplets. Shown is the time dependent growth of LDs after FA stimulation. HepG2 cells were either treated with the (K+) or without (K-) DMSO vehicle control or PA/OA (FA) for 24, 48 and 72 h. LDs are visualized with the ORO stain. Images were captured with a Nikon TiE phase contrast fluorescent microscope using the NIS elements software version 4.13. g Time dependent increase in intracellular lipid content of HepG2 cells treated with 1:1 mixture of 0.5 mM PA/OA for up to 72 h. Further information is given in Additional file 2: Figure S1, Additional file 3: Figure S2, Additional file 4: Figure S3. * denotes a significant p-value < 0.05 and ****p < 0.0001

