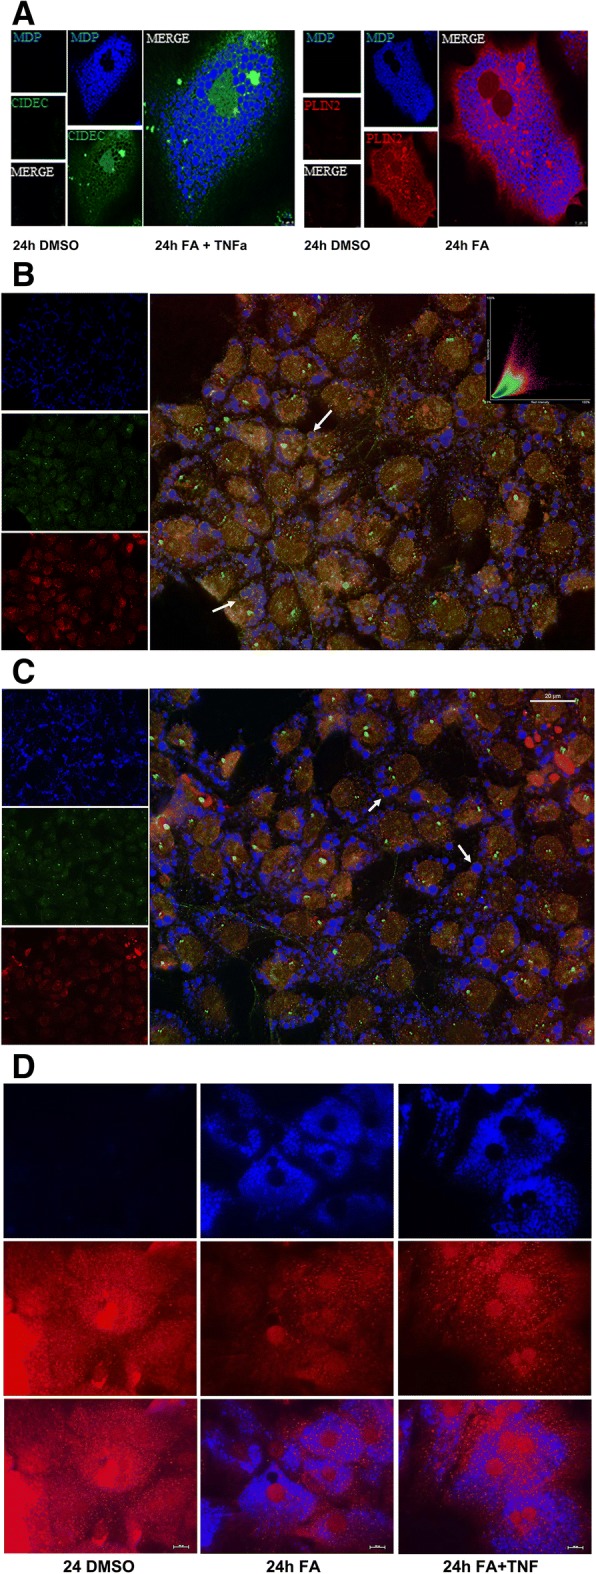
Fig. 4.

Immunofluorescence imaging of PLIN2, CIDEC and CPT1A protein expression in steatotic primary human hepatocyte cultures. a Primary human hepatocyte cultures were treated with a mixture of 0.5 mM PA/OA and stained individually for PLIN2 or CIDEC. Lipids were stained with the blue fluorescent dye MDP. CIDEC is given in green; PLIN2 expression is shown in red. b Co-localization of PLIN2 and CIDEC on the surface of LD monolayers. Primary human hepatocyte cultures were treated with a mixture of 0.5 mM PA/OA for 24 h and lipids were visualized the blue fluorescent dye MDP. Immunofluorescent staining of PLIN2 and CIDEC is given in the red and green channel, respectively. The co-localization image analysis was computed with a Pearson’s correlation coefficient of 0,806,395, a Manders overlap = 0,942,398 with K1; K2 = 0,751,118; 1,182,389 and a co-localization coefficient = 1:1. A scatter blot of the co-localization fluorescent signals is given as an insert. c Co-localization of PLIN2 and CIDEC on the surface of LD monolayers. Primary human hepatocyte cultures were treated with a mixture of 0.5 mM PA/OA and TNFα for 24 h and lipids were visualized the blue fluorescent dye MDP. Immunofluorescent staining of PLIN2 and CIDEC is given in the red and green channel, respectively. The bar represents 20 μm. d Immunofluorescence imaging of carnitine palmitoyltransferase 1A (CPT). Primary human hepatocyte cultures were treated with a mixture of 0.5 mM PA/OA for 24 h. Lipids were stained with the blue fluorescent dye MDP and CPT1A is shown in red. The images were captured with the Nikon TiE phase contrast immunofluorescent microscope with a 60x objective using the NIS elements software (version 4.13.); the scale bar is given in μm. The merged channels are given as large images and single channels are shown as smaller images
