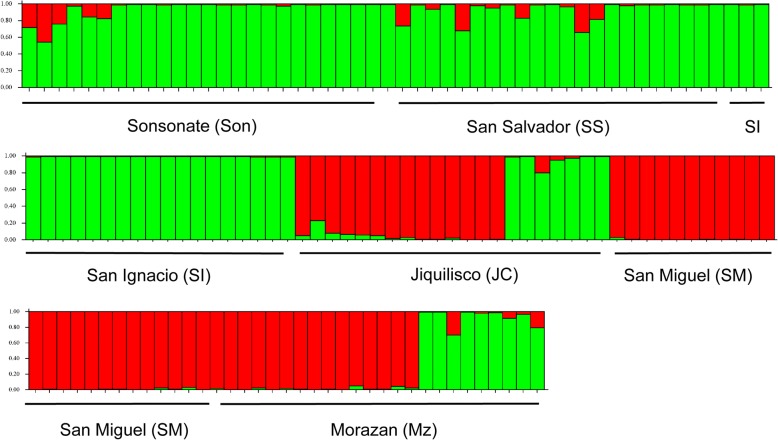
Fig. 2.
Analysis of population structure for Ae. aegypti with the software Structure 2.2.3. Parameters selected were for diploid individuals, 50,000 iterations, admixed data, and independent loci. Each vertical bar represents an individual mosquito. The y-axis shows the probability of an individual being assigned to one of the two genetic clusters. Structure Harvester found that K = 2; there were two genetically distinct populations

