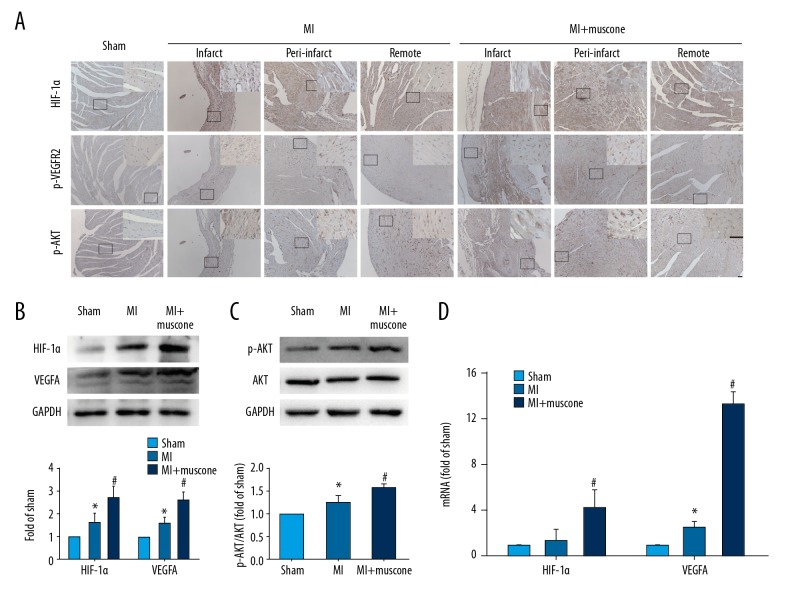
Figure 4.
Muscone increased expression levels of HIF-1α, VEGFA and p-AKT in left ventricular (LV) after MI for 4 weeks. (A) Representative photomicrographs of HIF-1α, p-VEGFR2, and p-AKT distribution in the infarct, peri-infarct, and remote region in the 3 groups by immunohistochemical staining. Identified according to the morphological characteristics, the cardiomyocytes showed HIF-1α and p-AKT-positive staining, and the vascular endothelial cells showed p-VEGFR2-positive staining. Bar=50 μm. (B) Western blot analysis of HIF-1α and VEGFA in the 3 groups. GAPDH served as the loading control. Quantification was shown. (C) Western blot analysis of AKT and p-AKT in the 3 groups. Quantification of p-AKT/AKT ratio is shown. (D) The mRNA expression levels of HIF-1α and VEGFA. Data are represented as mean ±SD, n=12 per group (* p<0.05 versus sham group, # p<0.05 versus MI group).

