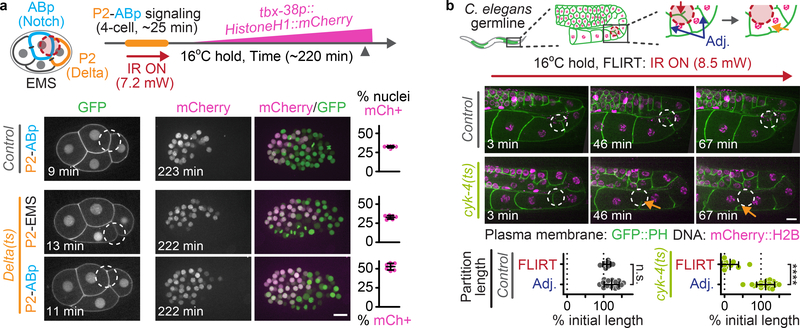
Figure 2:
FLIRT for subcellular control of ts protein function
(a) Experimental timeline schematic (top) and representative images (bottom) depicting FLIRT targeting either the P2-ABp or P2-EMS cell-cell contacts in 4-cell control and Delta(ts) embryos. Dot plots (right) show the percent total mCherry+ nuclei at the ~50 cell stage (control P2-ABp N= 7, Delta(ts) P2-EMS N=7, Delta(ts) P2-ABp N=7 biologically independent embryos). Green, GFP::PH (plasma membrane) and Histone(H2B/H3)::GFP (DNA); magenta, tbx-38p::HistoneH1::mCherry (see Methods) (b) Schematic (top) and representative time lapse images (bottom, representative from 7 biologically independent adult worms) depicting FLIRT targeting an individual membrane partition within the cyk-4(ts) adult C. elegans syncytial gonad. Arrows indicate membrane partition retraction. See Supplementary Video 7. Dot plots (bottom) showing the change in FLIRT-targeted and adjacent partition length after FLIRT targeting a single membrane partition in control and cyk-4(ts) worms shown as a percent of initial length (control N=7, cyk-4(ts) N=10 biologically independent worms). Time elapsed is shown in min after FLIRT initiation. Red dashed circles (schematics) and white dashed circles (images) indicate the FLIRT-targeted ROIs. Unpaired two-tailed t-test; n.s., no significance, p>0.05; ****, p≤0.0001. Error bars represent mean ± SD, see Supplementary Table 1 for additional statistical analysis. Scale bars=10 μm.

