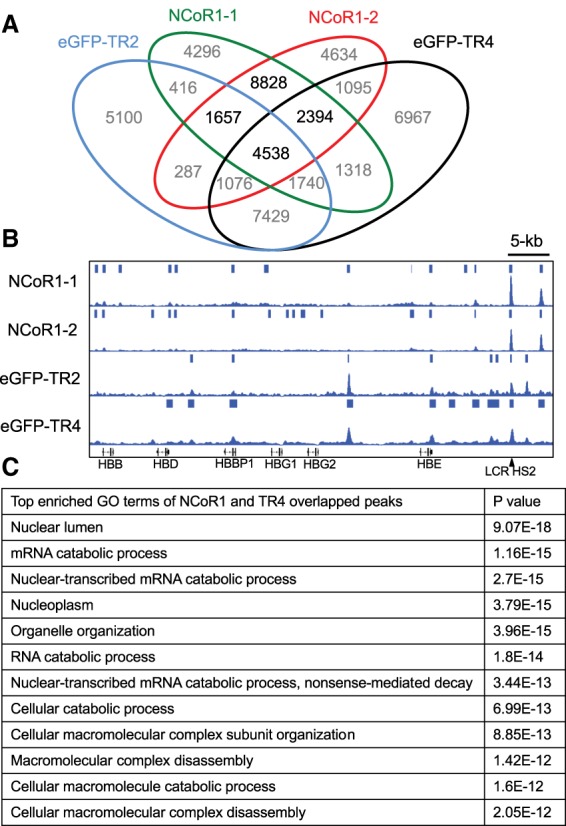
Figure 2.

TR4 and NCoR1 significantly overlap in genome-wide binding site distribution. (A) Venn diagram of TR4, TR2, and NCoR1 ChIP-seq peaks in human erythroleukemia K562 cells. (B) Representative NCoR1, TR2, and TR4 overlapping peaks in the β-globin locus. (C) The top enriched gene ontology terms extracted from the TR4, NCoR1-1, and NCoR1-2 overlapping peak-associated genes.
